
This edition updates the January 2026 paper with data published through September 2026. The model and its figures are unchanged; the conclusions have largely held. It adds a field test of the task scores against real usage data (Part 3) and revises the employment, insurance, and organizational discussions where the evidence moved. The appendix lists every substantive change.
Executive Summary
A widely cited study on the potential impact of AI on U.S. workers estimated that 80% of workers could have at least 10% of their tasks exposed to AI. Another study put the total percentage of current work that is technically automatable at 60–70%.1,2 Yet the U.S. Census Bureau’s business surveys put current AI use at roughly one business in five. Its 2026 supplement says AI-using firms currently employ only 32% of U.S. workers.3,4 These measures aren’t directly comparable, but the gap is wide. What accounts for this gap between the technical capabilities of AI and current adoption?
In this paper, we apply a governance model across roughly 148 million U.S. workers as represented by 18,898 work tasks across 848 occupations built from the Labor Department's O*NET database and BLS wage data to estimate the deployable wage mass for AI in U.S. businesses.5 Our main argument is that governance concerns can constrain the deployment of AI even when the task is technically exposed. We identify four key operational constraints: (1) consequence of error, (2) verification cost, (3) accountability requirements, and (4) physical reality. We also build three fictional organizational profiles to illustrate the way these constraints interact with technical deployability in the workplace. Finally, we score each occupational task on a five-point delegation-friction scale to estimate the share of U.S. wages that can be delegated to AI under sustainable governance and provide guidance on how managers can succeed with AI.5,6
Of the $10.2 trillion U.S. wage base, the model estimates $3.24 trillion (31.8% of wages) in annual AI opportunity, of which $1.6 trillion (15.7%) is the governance-safe floor. The remaining $1.64 trillion (16.1%) depends on human-AI workflows and governance assumptions. The other $6.96 trillion (68.2%) stays with human workers, including the human time within AI-assisted tasks, in what we call Protected Work.5
Further, the paper describes three signals from outside the model that reinforce the thesis that governance limits AI deployment: (1) legal rulings, (2) insurance policy trends, and (3) frontier model usage data. A Canadian tribunal and a German court have held organizations liable for chatbot statements. A U.S. court allowed claims of discrimination against an AI hiring-screen vendor to proceed past the pleading stage.7,8,9 Meanwhile, standard-line insurance companies have filed for AI exclusions to their business insurance policies, specialty carriers have begun offering affirmative coverage, and some underwriters use governance as an input.10,11,12,13,14 These trends suggest that the cost of AI errors is shifting to the organizations deploying AI. Lastly, tasks we score as hard to delegate appear less often than tasks we score as safer to delegate in Anthropic’s recently published usage data.15
With regard to AI automation replacing workers, our near-term forecast is that AI will more often refactor tasks and change the composition of roles than it will eliminate whole jobs. The longer-term balance between worker displacement and new job creation has yet to play out. The distillation of work implies that routine, structured tasks may move to AI, while human work expands as AI coordination and supervision tasks are added to job descriptions. Early payroll data show employment of 22- to 25-year-olds in AI-exposed occupations is falling behind less-exposed peers, mostly through reduced hiring. The trend is worth tracking, but researchers have not established how much, if any, of the gap is due to AI.16
At the same time, our forecast suggests that many managers may well miss the opportunity to leverage AI’s remarkable capabilities by implementing AI solutions before doing the foundational work of putting governance in place and building workforce fluency, including familiarity with the key operational constraints. The minority of managers who succeed will start by identifying what is safe to delegate today, thereby earning both executive and organizational confidence, and expand the use of AI systematically along with training. A select few will even do the necessary planning to capture and reinvest their AI efficiency gains into new strategic activities that will transform their operations and elevate their competitive position.
Part 1: The Deployment Gap
OpenAI’s 2023 study estimated that 80% of U.S. workers could have at least 10% of their work tasks affected by large language models.1 McKinsey estimated that generative AI and other technologies could technically automate activities taking 60–70% of employees’ time.2 Adoption tells a different story. The Census Bureau’s biweekly survey put the share of U.S. businesses using AI in any function at 17% in December 2025 and 20% in May 2026, inside the range the firms themselves had forecast.3 The Bureau’s 2026 AI supplement gives employment-weighted figures: 18% of firms use AI, and they employ 32% of the workforce. The 23% of firms that report workers using AI in their tasks employ 41%.4 These counts include every employee of those firms, so the share of workers who use AI at work is lower.
That leaves a gap between broad potential exposure and current use: 80% of workers could have at least 10% of tasks affected, while AI-using firms employ 32% to 41% of the workforce, depending on the measure.1,4 That is wide, and it gets wider once depth is counted. Among adopting firms, 57% use AI in three or fewer of fifteen business functions, 65% limit worker use to three or fewer task types, and 66% of those reporting any effect on tasks report augmentation only.4 The gap is now better described as thin use than as non-use.
Economists at The Anthropic Institute use the Census series to calibrate their AI diffusion parameter. They set the mid-2026 diffusion share at 10% of instances within tasks AI can affect. Their model-wide share of instances performed with AI is the product of the share of work AI affects and that diffusion parameter. They explain that firm-level adoption shares overstate actual task-instance use because adopters apply AI to few tasks and only some instances.17
This gap demands explanation. If AI applies to almost every task, why is deployment so shallow, and what constraints explain it?
Exposure Is Not Deployment
Early research answered an important question: what can AI do, theoretically? The answer was “almost everything.” But that is not the question organizations face. The real question is: what can we safely deploy under realistic governance, liability, and verification constraints?
Technical exposure is not deployment. The usage side of the ledger says the same thing as the adoption side. Anthropic’s Economic Index reports that 49% of jobs have seen its models used on at least a quarter of their tasks, a figure that has not moved since September 2025. In computer and mathematical occupations, where theoretical exposure runs to 94%, observed coverage is 33%.18
Our task-level model estimates that 92% of U.S. wage mass has technical AI exposure, but only 15.7% is ready to delegate under the model’s current governance assumptions. Another 16.1% is assigned to assisted workflows.5 This is a modeled opportunity, not an observed deployment rate. The gap points to organizational conditions that exposure studies do not measure.
Bill Gates, in an August 2026 essay, treats the deployment gap as lag and denial: reliability is improving fast, the tools run on devices people already own, and substitution across white-collar and then blue-collar work follows within a decade.19 Goldman Sachs Research’s June 2026 baseline estimates that about 9% of U.S. workers may be reallocated to new positions over a ten-year AI transition. It expects the annual increase in the unemployment rate to remain below one percentage point.20 The Anthropic Institute’s model sets out three scenarios, not predictions, and assigns them no probabilities. They yield a 2030 economy 1.6%, 8.3%, or 32% larger than its no-AI counterfactual, with unemployment among cognitive workers at 2.9%, 4.5%, or 17.9%. The scenarios vary the share of tasks AI can affect and the share of those task instances where AI is used. Both are assumptions, with the latter set at 20%, 40%, or 60% by 2030.17 In a survey of 10,980 U.S. adults, median answers were close to the model’s substantial-change scenario.17 These sources describe possible futures. The evidence below records what has happened.
Converging Evidence
Three market signals show that legal duties, insurance terms, and deployment governance shape adoption alongside technical capability.
Organizations remain accountable for AI-assisted actions under distinct legal theories. A British Columbia tribunal held Air Canada liable for its chatbot’s incorrect refund-policy statement.7 In May 2026, Germany’s Higher Regional Court of Hamm held a cosmetic-surgery clinic responsible under unfair-competition law for a false claim made by its website chatbot.8 In Mobley v. Workday, a federal court allowed some amended claims against an AI hiring-screen vendor to proceed at the pleading stage. The 2024 agency ruling and June 2026 order addressed different claims. No liability has been established.9 These cases do not establish one general liability rule.
Insurers are filing AI exclusions, while specialty carriers announce affirmative coverage. In January 2026, Verisk made three generative-AI exclusions available for commercial general liability policies.21 By July, 41 property-and-casualty insurance groups had a subsidiary file to adopt an AI exclusion, while subsidiaries of 20 other groups had filed to delay adoption. The Insurer reviewed nearly 10,000 filings, and its article reports that some carriers did not plan to implement exclusions immediately.10 A public CSIS account of Wolfe Research data said regulators had approved more than 80% of carrier requests to exclude AI-related damages as of April 23, 2026.10 W. R. Berkley’s “absolute” exclusion for directors, officers, and professional liability applies to claims arising from AI use, deployment, or development.11 The cited forms apply according to their wording and do not distinguish between well-governed and poorly governed uses.11 The cited filing data do not show how often exclusions attach at policy renewal.10
Specialty carriers and managing general agents have announced several affirmative AI offerings since 2025, including policies or programs from Armilla, Testudo, Munich Re and Mosaic, HSB, and Mayflower and Hadron. Chaucer and Armilla also announced a coordinated structure with dedicated AI limits of at least $25 million. These company announcements show product activity, not the size or coverage of the market.12 Munich Re describes technical due diligence. Mayflower’s launch announcement says its underwriting addresses model bias, drift, and hallucination risk.12 CFC says it has added affirmative AI coverage to seven product lines.13
The announcements do not establish how consistently carriers use governance evidence in underwriting or pricing. Verisk says it is evaluating optional policy language for additional AI exposures, including agentic AI.14 This shows that policy wording is still under study. It does not establish a market consensus on which AI uses should be excluded.
Insurers deploy AI aggressively in their own operations. The industry outpaces nearly all others in adopting AI for underwriting, claims, fraud detection, and customer service.22 One possible explanation is information asymmetry: an insurer can inspect its own AI controls more readily than a policyholder’s deployment practices. The cited sources do not test that explanation. It is an interpretation of the contrasting adoption and coverage signals.
Part 2: The Four Constraints and Five Delegation Categories
Four types of operational constraint determine which AI systems deploy and which do not. They exist independently of capability. A perfect model can still be undeployable because of operational requirements.
The Four Constraints
Consequence of Error. What does it cost when AI is wrong? A poorly worded social media post is benign. A payment-processing error is serious but reversible. A diagnostic error can kill. The level of consequence sets how much AI risk a firm can tolerate.
Verification Cost. Can someone check AI’s output without redoing the work? Software code can be verified by cheap automated tests. A medical diagnosis requires a highly paid physician to re-examine the case, which can cost more than making the diagnosis in the first place. When verification costs equal or exceed the efficiency gained, the economic case collapses. Economists call this “so-so automation”: technology that displaces labor without net productivity gain.23
Accountability and Presence. Does the task require human authorization or authentic human presence? In clinical workflows, the American Medical Association’s stated position is that clinical decision-making remains with clinicians, even when AI provides recommendations.24 Other tasks require authentic human presence: counseling, leadership, and negotiation, where the relationship is part of the work. Two limited marketing studies report lower engagement with suspected AI content. Originality.ai’s analysis of 2,726 long LinkedIn posts, classified with its own detector, found 45% lower average engagement for posts labeled likely AI. A Raptive-commissioned survey of 3,000 U.S. adults found a 14% drop in purchase consideration when ads appeared beside content respondents suspected was AI-generated.25 These results apply to those samples and measures. They do not establish a general penalty for AI-generated content. In games, named cases include removal of generative art and synthetic voices from titles, and the 2025 performers’ agreement requires informed consent and disclosure before digital replicas are used.26 The 2026 GDC survey found that 52% of respondents thought generative AI was having a negative impact on games, up from 30% in 2025, and 16% said their workplace did not allow the tools.26
Physical Reality. Does the task require manipulating atoms in an unstructured environment? Software scales. Physical work remains constrained by safety, hardware, and integration costs. Svanberg and colleagues estimated that only 23% of technically exposed computer-vision tasks were economically attractive to automate after upfront costs were included.27 Goldman Sachs compares simulated daily costs of about $13 for a coding agent with roughly $300 for comparable human labor. Its estimates for call-center and data-entry agents are closer to parity.28 These are model estimates, not observed customer returns.
Viral demonstrations of humanoid robots have fueled speculation that general-purpose physical automation is imminent. The public record is narrower.29 On September 20, 2026, Ashok Elluswamy, who leads Tesla’s Optimus program, wrote of one widely shared demonstration that “these robot moves are essentially remote controlled” and that the robot “rather blindly performs those while maintaining balance.” On Tesla’s earnings call of January 28, 2026, asked how many Optimus units were in Tesla’s own factories performing production tasks, Elon Musk said the program was still in its “R&D phase,” that units had done some basic tasks, and that Optimus was “not in usage in our factories in a material way.” Those tasks, he said, were so the robot could learn.
A few pilots have done narrow, repetitive work. Figure AI reports that its robots spent eleven months at BMW’s Spartanburg plant loading sheet metal: 1,250 hours and 90,000 parts, in support of 30,000 X3s. Agility Robotics reports more than 65,000 hours at customer sites, including 100,000 totes moved at one GXO warehouse. Those are company-reported hours and counts. The cited accounts do not report a price, labor saving, or payback. A contract is not a return. The commercial case for humanoid robots in production remains a projection, and autonomous work in unstructured physical settings faces capital and safety constraints.29
The Five AI Delegation Categories
To see how the four constraints interact on real tasks, we defined five categories of AI delegation, from work that can be handed to AI with minimal oversight to work that stays human.
| Delegation Category | Human Role | When It Applies |
|---|---|---|
| Automated | Governor | Low consequence, affordable verification, delegable, digital |
| Verified | Editor | Moderate consequence, deterministic checks, digital |
| Guided | Pilot | Expert verification is required; humans are engaged throughout |
| Assisted | Judge | High consequence or non-delegable; AI prepares, humans must decide |
| Human-Only | Actor | Safety-critical physical work or authentic human presence required |
Automated and Verified work permits rapid delegation because verification is affordable or unnecessary. Guided and Assisted work improves productivity, but humans remain accountable. Human-Only work stays human.
The categories describe how work is delegated, not how much a tool gets used. In usage data, only the ends of the scale separate cleanly. The middle shows up as a shift in the mode of use, from execution toward assistance, which is what the categories predict.
Part 3: The National Opportunity
Starting from O*NET task and occupation data and Bureau of Labor Statistics wage data, we built an expanded task-level database covering 18,898 tasks across 848 occupations representing about 148 million U.S. workers. We sorted tasks by their centrality to each role, categorizing each as Core Work (the specialized duties that define the role) or Coordination Work (the administrative overhead common to nearly all occupations). We calculated the delegable share of wages after assigning delegation categories to core tasks and applying a coordination coefficient to coordination tasks.6,5
The model estimates AI-delegable wage mass under stated governance assumptions. The companion document describes the method and limits, and the replication package preserves the task and wage calculations.5
Core Work Versus Coordination Work
Every job is a mixture of specialized production and administrative overhead. To analyze where AI can actually deploy, we divide daily work into two distinct domains:
Core Work consists of the specialized, domain-defining tasks that justify a worker’s role: an engineer designing a bridge, an internist diagnosing illness, a machinist milling precision parts, a lawyer drafting a brief. Core tasks define the occupation, carry the bulk of organizational risk, and are where domain governance constraints bind hardest.
Coordination Work is the universal administrative overhead that surrounds every role: scheduling meetings, triaging email, drafting status updates, logging interactions, searching for documents, preparing briefings, and managing calendars. It is the work about work that accumulated over decades as organizations layered on communication processes. Two sources give related but different measures: Asana’s 2024 survey estimated that knowledge workers spend 58% of their time on work about work, while Microsoft reported that 60% of time within Microsoft 365 apps was spent in email, chat, and meetings.30 They do not measure the same thing or establish a universal share of every workday.
This distinction is foundational to our economic model. Because the model treats much coordination work as digital and comparatively cheap to verify, it assigns coordination overhead a separate opportunity estimate. The estimate is not a finding that every coordination task can be safely automated. A firm must assess its own consequences, verification costs, and controls.5
$3.24 Trillion Under Governance Constraints
The model estimates the present U.S. opportunity for AI delegation at $3.24 trillion annually (31.8% of U.S. base wages) under base assumptions, with a sensitivity range of $2.47 trillion to $4.34 trillion.5 The $3.24 trillion and 31.8% are the rounded tiers added together. The same calculation on the unrounded database totals is $3.25 trillion, 31.92% of wages. The aggressive Assisted case prints as $1.12 trillion, though unrounded it is $1.11 trillion.
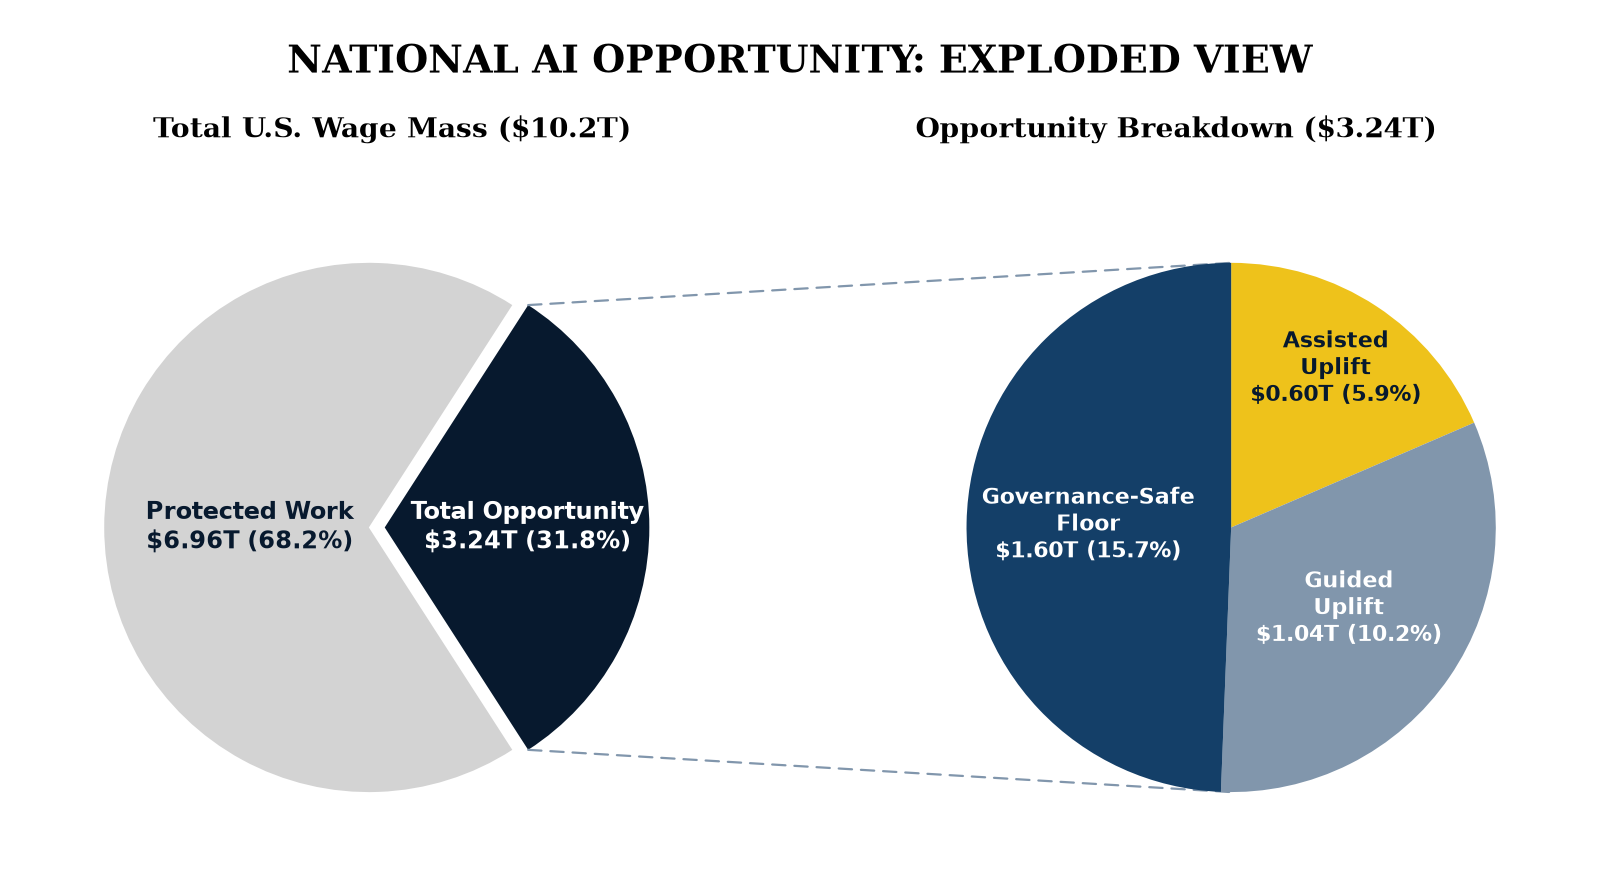
Figure 1: National AI Opportunity in Context5
The pie chart shows total AI delegation opportunity broken down by the Governance-Safe floor and the Guided Uplift and Assisted Uplift categories. Protected wages (68.2%) represents tasks where governance constraints preclude delegation: the Human-Only tasks that remain undelegated, including the human time within AI-assisted tasks.5
The Governance-Safe Floor: $1.60 Trillion Annually
We estimate the governance-safe floor for AI delegation in the U.S. at $1.6 trillion annually. This is work the model classifies as ready to delegate under its assumptions because verification is affordable and deterministic.5
$1.02 trillion in core work delegation (10.0% of wages): Tasks for which checking the AI’s output costs far less than doing the work, such as payment processing, data extraction, document classification, routine calculations.5
$0.58 trillion in coordination efficiency (5.7% of wages): Reducing the “work about work” (scheduling, status updates, email triage) that burdens every role. This is a modeled opportunity, not a claim that AI can recover all the time measured by the external surveys.30,5 AI may reduce some coordination overhead while core work stays human.
This floor is conservative and immediately actionable.
Guided Uplift: $0.52 Trillion to $1.74 Trillion
Guided Uplift is the productivity gain from human-anchored workflows where AI assists but humans remain engaged: code development, content creation, and research. Two task experiments found large but bounded gains: Noy and Zhang’s writing tasks were completed 40% faster on average, with quality 18% higher. Peng and colleagues found developers completed one programming assignment 55.8% faster with GitHub Copilot.31 Neither result estimates general workplace productivity. The task-level usage analysis finds that higher-friction tasks appear more often in assistance than execution modes in Anthropic’s published sample.15 The model applies net time-reduction assumptions of 15%, 30%, and 50% after verification overhead.5
Conservative assumptions (15% net time reduction after verification overhead): $0.52 trillion
Base assumptions (30% net reduction): $1.04 trillion
Aggressive assumptions (50% net reduction): $1.74 trillion
Assisted Uplift: $0.27 Trillion to $1.12 Trillion
Gains where AI accelerates preparatory work (data extraction, option generation, analysis) but humans make final calls because accountability cannot transfer. This includes underwriting, diagnostic support, legal research, and strategic planning. The model applies net time-reduction assumptions of 12%, 27%, and 50%.5
Conservative assumptions (12% net time reduction): $0.27 trillion
Base assumptions (27% net reduction): $0.60 trillion
Aggressive assumptions (50% net reduction): $1.12 trillion
Gains are smaller and more variable because verification often approaches the cost of re-derivation.
Human-Only Work: Practice Environments and Sparring Partners
While the model assigns no direct efficiency value to Human-Only work, AI can still support practice and feedback. It can provide simulated environments for rehearsing high-stakes scenarios such as grief counseling, difficult negotiations, and crisis leadership, or offer critiques and alternative perspectives. Those possible quality gains are outside the model’s efficiency estimates.5
Testing the Scores: What Real Use Shows
Our delegation friction scores assign each task to an operational tier based on governance constraints, predicting which work organizations will find safe to hand to AI and which they will reserve for humans. Anthropic’s Economic Index now publishes observed usage data at the level of individual O*NET tasks, the same catalog our model scores.15 That makes it possible to test whether tasks scored as hard to delegate appear less frequently in real-world AI use than tasks scored as safe to delegate.
We joined our friction scores for 13,643 O*NET tasks to Anthropic’s published task-level usage data for April and May 2026, matching by task identifier. Of the published chat tasks, 78% matched a scored task in our database, and 79% of the published API tasks did. Matched tasks account for 76% of published chat usage and 69% of published API usage. The question was whether tasks scored as hard to delegate appeared less often than tasks scored as easy.15
In this sample, 44% of tasks scored as safe to delegate appeared in Anthropic’s published usage, compared with 3% of tasks scored as human-only. The decline was monotone across the five scores and held within occupations and, more weakly, within digital-only tasks. The same ordering appears across three data releases since November 2025.15
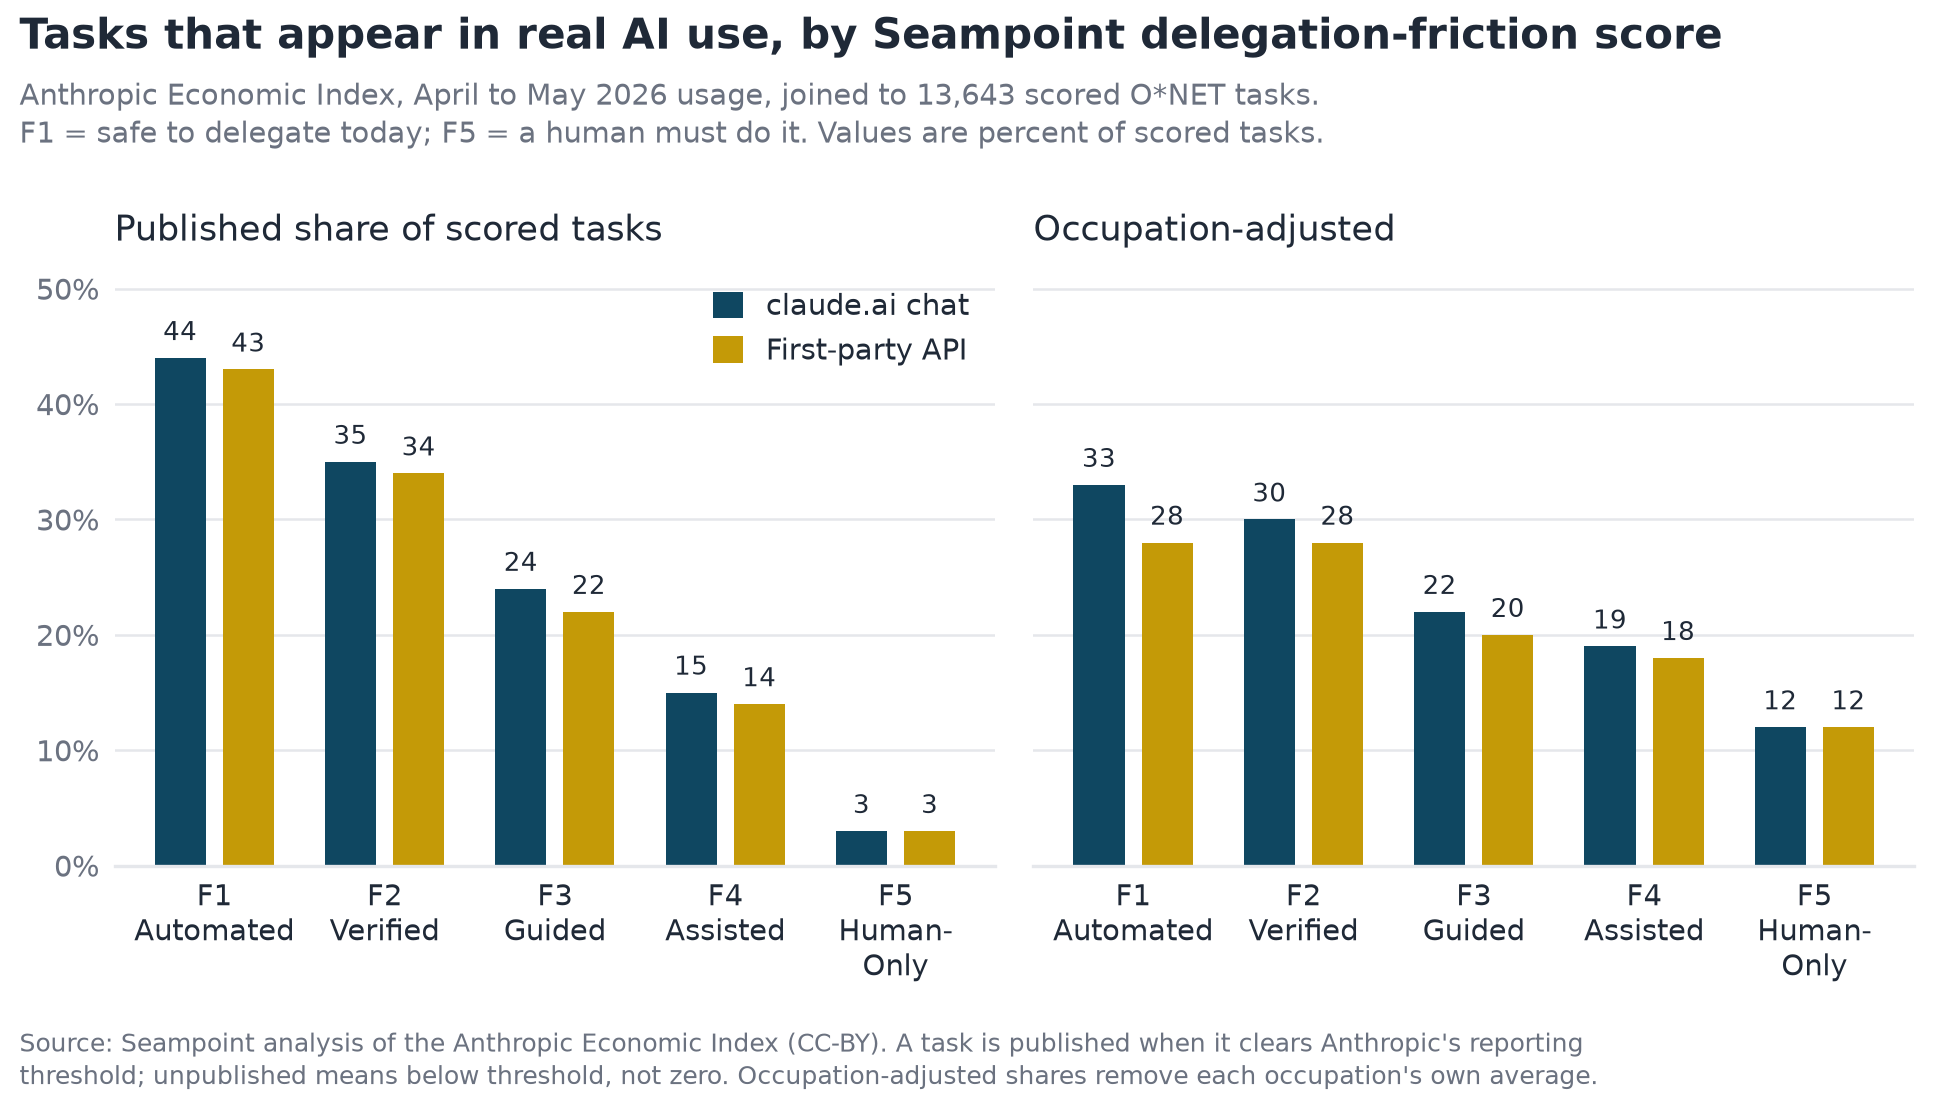
Figure 2: Tasks that appear in Anthropic’s published usage data, April-May 2026, by Seampoint delegation-friction score (1 = safe to delegate today, 5 = human must do). Occupation-adjusted shares remove differences in overall AI use between occupations. Source: Seampoint analysis of the Anthropic Economic Index; method in the companion document, section 5.6.15
Anthropic reports usage across Claude conversations and first-party API calls. Both channels show a decline from safe to human-only tasks (44% to 3% in chat, 43% to 3% in API). These are Anthropic’s published usage samples. Neither is a representative sample of enterprise deployment.15
The relationship holds across occupations and within digital-only tasks, with one notable exception: software and computing occupations.
| Occupational cluster | Scored tasks | Published chat correlation | Published API correlation | Primary pattern |
|---|---|---|---|---|
| Healthcare practitioners and technical (SOC 29, 31) | 1,842 | -0.109 | -0.127 | Strong governance constraints; high friction suppresses presence |
| Office and administrative support (SOC 43) | 1,120 | -0.122 | -0.095 | Routine tasks dominate; safe tasks heavily represented |
| Management occupations (SOC 11) | 985 | -0.127 | -0.063 | Judgment and accountability constraints bind presence |
| Business and financial operations (SOC 13) | 840 | -0.093 | -0.096 | Mixed; compliance and verification limit core delegation |
| Computer and mathematical (SOC 15) | 610 | +0.014 | +0.013 | Saturated usage; friction scores do not predict task presence |
In the computer and mathematical cluster, task presence is essentially uncorrelated with the model’s friction scores. This describes Anthropic’s published sample, not all software workers or deployments. The mode-of-use data show a separate distinction: higher-friction tasks tend to involve less autonomous, less work-related use.
What simple presence data cannot see is the operational middle of the scale: the distinction between Guided (F3) and Assisted (F4) work. That distinction appears in the mode of use rather than volume. Among published chat tasks in Anthropic’s data:15
For F1 Automated tasks, 72% of interactions operate in full automation mode (the model executes the task directly), and 64% are work-related.
For F2 Verified tasks, automation falls to 57%.
For F3 Guided tasks, automation falls to 49%.
For F4 Assisted tasks, autonomous execution drops to 47%, and work-related use drops to 46%.
As delegation friction rises, user behavior shifts from unilateral machine execution toward interactive dialogue, augmentation, and exploratory testing. That matches exactly what the Guided and Assisted categories describe: work where AI acts as a thinking partner or research accelerator while the human retains accountability.
Two limits matter. The data come from one vendor’s self-selected users, not from governed enterprise deployment, and Anthropic publishes a task only when it clears a privacy threshold, so “absent” means “below threshold,” not zero. And the test corroborates the ordering of tasks, not the dollar figures, which also depend on tier rules and wage weights.
Part 4: How Transformation Actually Happens
Distillation, Not Necessarily Elimination
To understand how governance constraints play out across sectors, we constructed three illustrative workforce profiles: a regional bank, a health system, and a custom equipment manufacturer. Their roles follow O*NET/SOC categories and use May 2024 BLS wage benchmarks. Company identities, assets, locations, payrolls, headcounts, and role distributions are scenario inputs, not observed employer data or industry-standard distributions.32 The profiles show how the same model produces different deployment maps for different workforce mixes.
The model describes one possible path: task mix changes inside a role before the job disappears. We call that distillation, not an observed national pattern or a headcount forecast. It means routine, structured tasks may move to AI, while human work may expand and new coordination or supervision tasks may be added. The model does not estimate how those changes affect total employment.
The studies cited here do not establish widespread AI-linked job elimination, but they also do not establish that AI generally creates jobs. Danish administrative records show no detectable change in earnings or hours two years after ChatGPT, with confidence intervals ruling out effects larger than 2%. Task reorganization inside adopting workplaces was widespread.33 A study of 21,559 U.S. firms found that firms with the heaviest AI spending grew headcount by about 10% over two years, with entry-level headcount up 12%. These firms were already larger, faster-growing, and more technical, so the result is an association rather than a causal effect.34 The Census supplement reports AI-related headcount reductions at 2% of AI-using firms.4 McKinsey’s 2026 survey found that 14% of AI-using organizations said AI reduced their workforce in the previous year, compared with 32% of respondents who had expected reductions in its 2025 survey.35
Capturing and Reinvesting Reclaimed Human Capital
Role distillation is not a passive outcome. It is an architectural choice. Without deliberate planning, the human capacity AI frees is easily reabsorbed by the coordination tax of unnecessary meetings and administrative drift. Leaders must reverse the sequence: identify the high-value initiatives that demand human ingenuity first, then fund them with the capacity reclaimed from AI. You cannot bank efficiency. You must reinvest it.
Klarna ran the experiment in public. In 2024 the payments firm said its AI assistant was doing the work of 700 customer-service agents. By May 2025 its chief executive told Bloomberg that cost had been over-emphasized and quality had fallen, and the firm began hiring people back. By mid-2026 it described a hybrid model in which “human customer service will almost be seen as a VIP thing.”36 The transactions were automated. The judgment work came back, and it came back as the premium service.
The Teller Who Became an Advisor
ColdWest Bancorp is a fictional Midwest regional bank: $25 billion in assets, 110 branches, 2,910 employees. Built on deep relationships with middle-market manufacturers and commercial real estate developers. A conservative credit culture that prizes relationship stickiness over geographic expansion.
Consider Maria, a composite of their 900-person teller workforce.
Ten years ago, Maria’s day was transactions. Cash deposits. Check processing. Balance inquiries. Work that required accuracy and a pleasant demeanor, but not much judgment.
In this scenario, routine deposits and balance checks have shifted toward digital channels, while branch visits are more often advisory. An ABA survey of 4,508 U.S. adults found that 55% named mobile banking as their primary method, compared with 22% online and 8% in a branch. Those preferences make the channel shift plausible, but they do not measure transaction shares or historical branch traffic.37 Maria still works there, and her role has changed.
Now when customers come in, they come with problems. A small-business owner whose cash flow does not match his loan covenants. A retiree confused by an estate transfer. A young couple who need someone to walk them through their first mortgage. Maria has become an advisor, a problem-solver, a relationship manager. The transactions shifted to automated channels. The judgment work concentrated.

This pattern, documented by economists studying automation’s historical effects,38 is what we mean by role distillation. The work did not disappear. Its composition shifted toward high-judgment problem-solving.
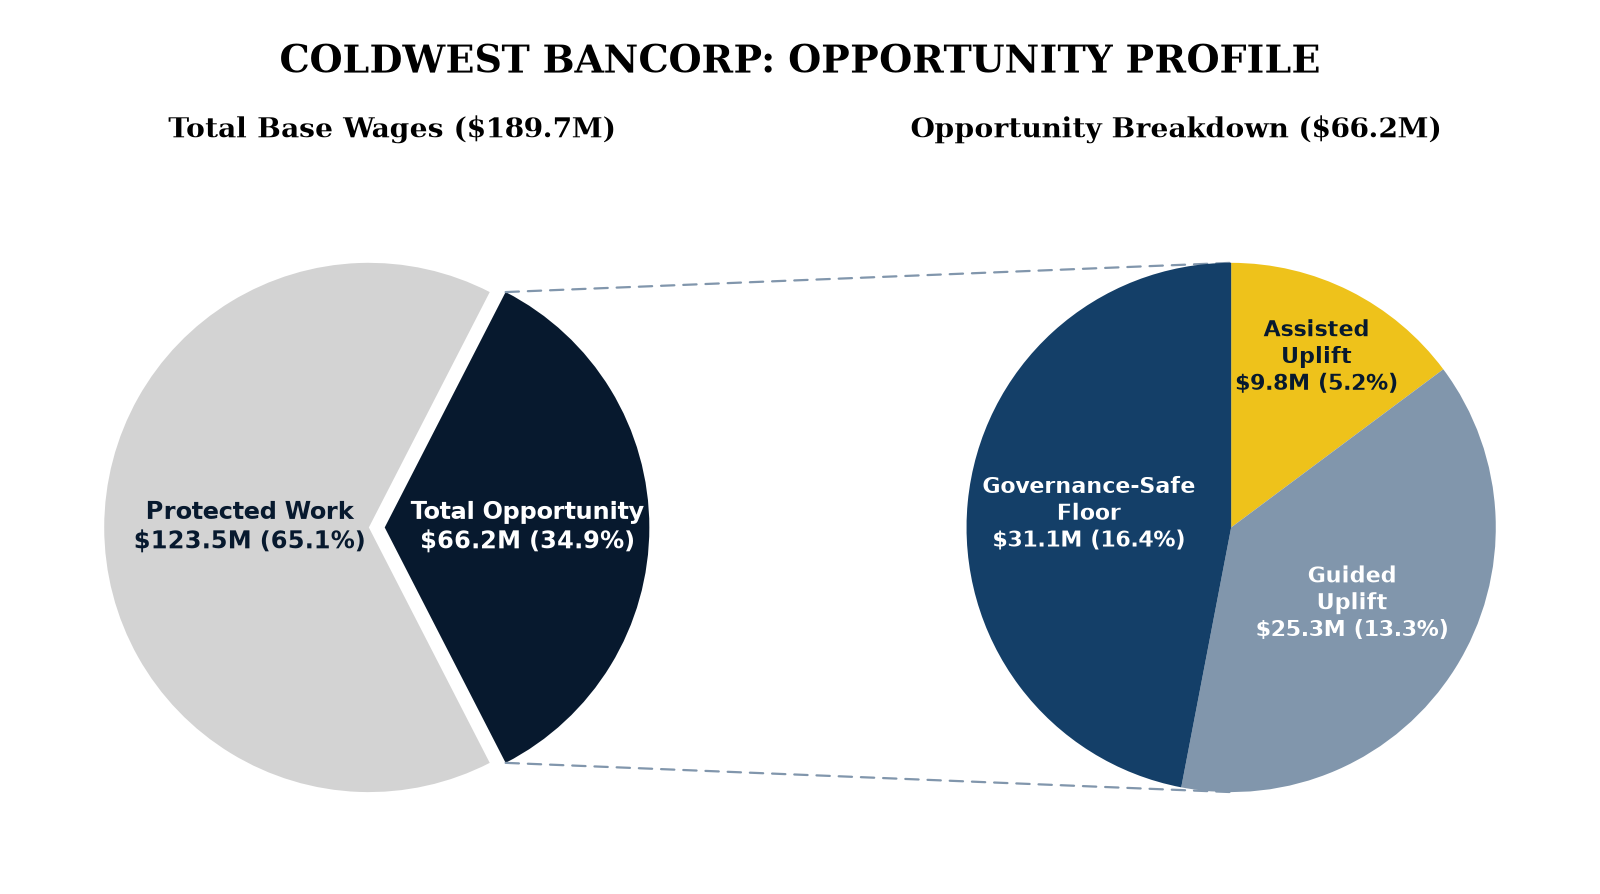
Figure 3: ColdWest Bancorp: AI Opportunity Profile
Base wages: $189.7M | 2,910 employees | Fictional regional bank, Midwest
In this constructed profile, the model assigns opportunity across all three tiers. That result follows the scenario’s assumed roles and task mix. O*NET occupations and BLS wages do not establish typical staffing distributions for regional banks.5,32
In this scenario, AI-assisted fraud-alert triage could let the same analyst team review a larger volume of alerts. The model does not estimate the resulting relationship between customer growth and compliance staffing, so this is a possible operating scenario rather than a measured scaling effect.5,32
The question for ColdWest’s leadership: Will they use their new AI-enabled capacity to deepen client relationships and launch new advisory services, or will they let these gains be absorbed by legacy processes and miss the chance to shift their competitive value proposition?
The Physician Who Retains Clinical Authority
KaleidoHealth is a fictional non-profit health system in the Southeast: multiple hospitals, outpatient clinics, a 3,000-physician medical group. A clinical and economic anchor for its region, it has 32,900 employees and pays them $2.58 billion in wages annually.

Consider Dr. Sarah Chen, an internist in KaleidoHealth’s primary care network.
The constructed profile assigns a 46.7% coordination share to its primary-care physician role. That is a model output, not a time-study result for real internists. The scenario’s examples include charting, inbox management, prior authorizations, referral letters, and quality reporting.32
In this constructed profile, the model places Dr. Chen’s high-consequence clinical decisions in the Guided and Assisted categories because they require expert review. The AMA’s stated position is that clinical decision-making should remain with clinicians. This is professional guidance, not a claim that malpractice law makes every clinical task legally non-delegable.24,32
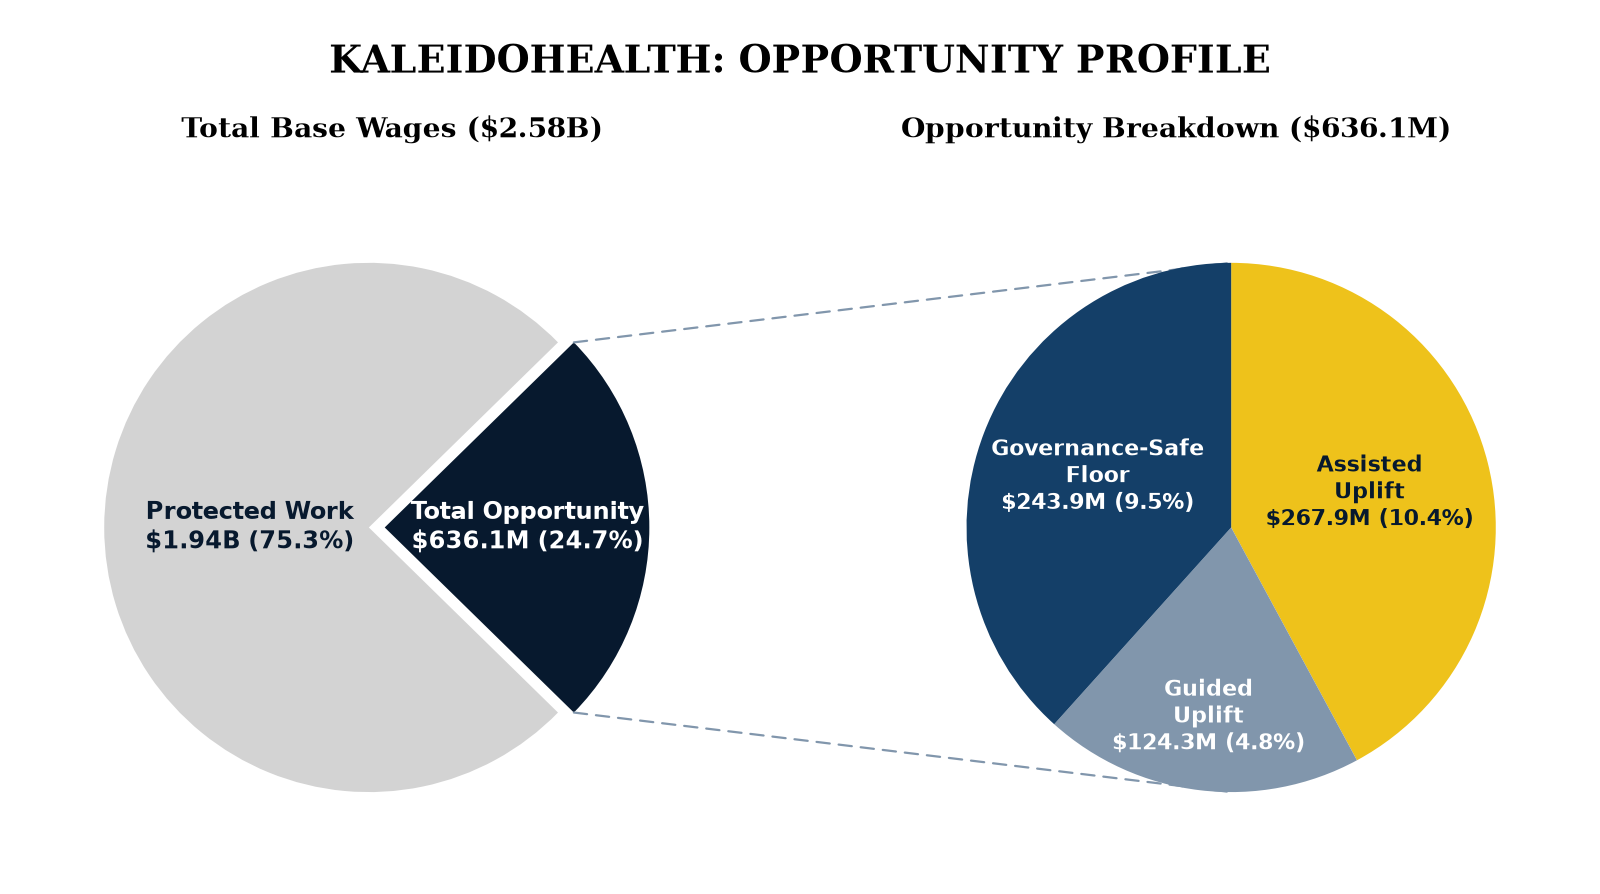
Figure 4: KaleidoHealth: AI Opportunity Profile
Base wages: $2.58B | 32,900 employees | Fictional non-profit health system, Southeast
The opportunity at KaleidoHealth concentrates in two areas. First, reducing the coordination tax: ambient documentation that drafts clinical notes from patient conversations, automated prior authorization packaging, intelligent inbox triage. This frees physician time without touching clinical decision-making. Second, Guided Uplift: clinical decision support that helps physicians review complex histories faster, catch rare conditions, and stay current with medical literature.
The billing department is the contrast. Medical coders have high Automated and Verified task shares because their tasks follow structured rules verifiable against payer requirements. Here role distillation is highly visible: AI handles routine coding, and humans shift to exception handling, denial-pattern analysis, and coaching physicians on documentation. That work creates more value than mechanical code lookup.
The question for KaleidoHealth’s leadership: Will they redesign clinical workflows to capture freed capacity as patient time, or let coordination overhead expand to fill the vacuum?
A Welder in a Custom Fabrication Scenario
Pacific FoodPro Systems is a fictional manufacturer of custom food-processing equipment in the Pacific Northwest. Its constructed profile assigns 1,361 workers and $121.5 million in annual base wages. U.S. food-plant rules require equipment to be adequately cleanable and food-contact seams to be smoothly bonded or maintained to limit residue buildup.39
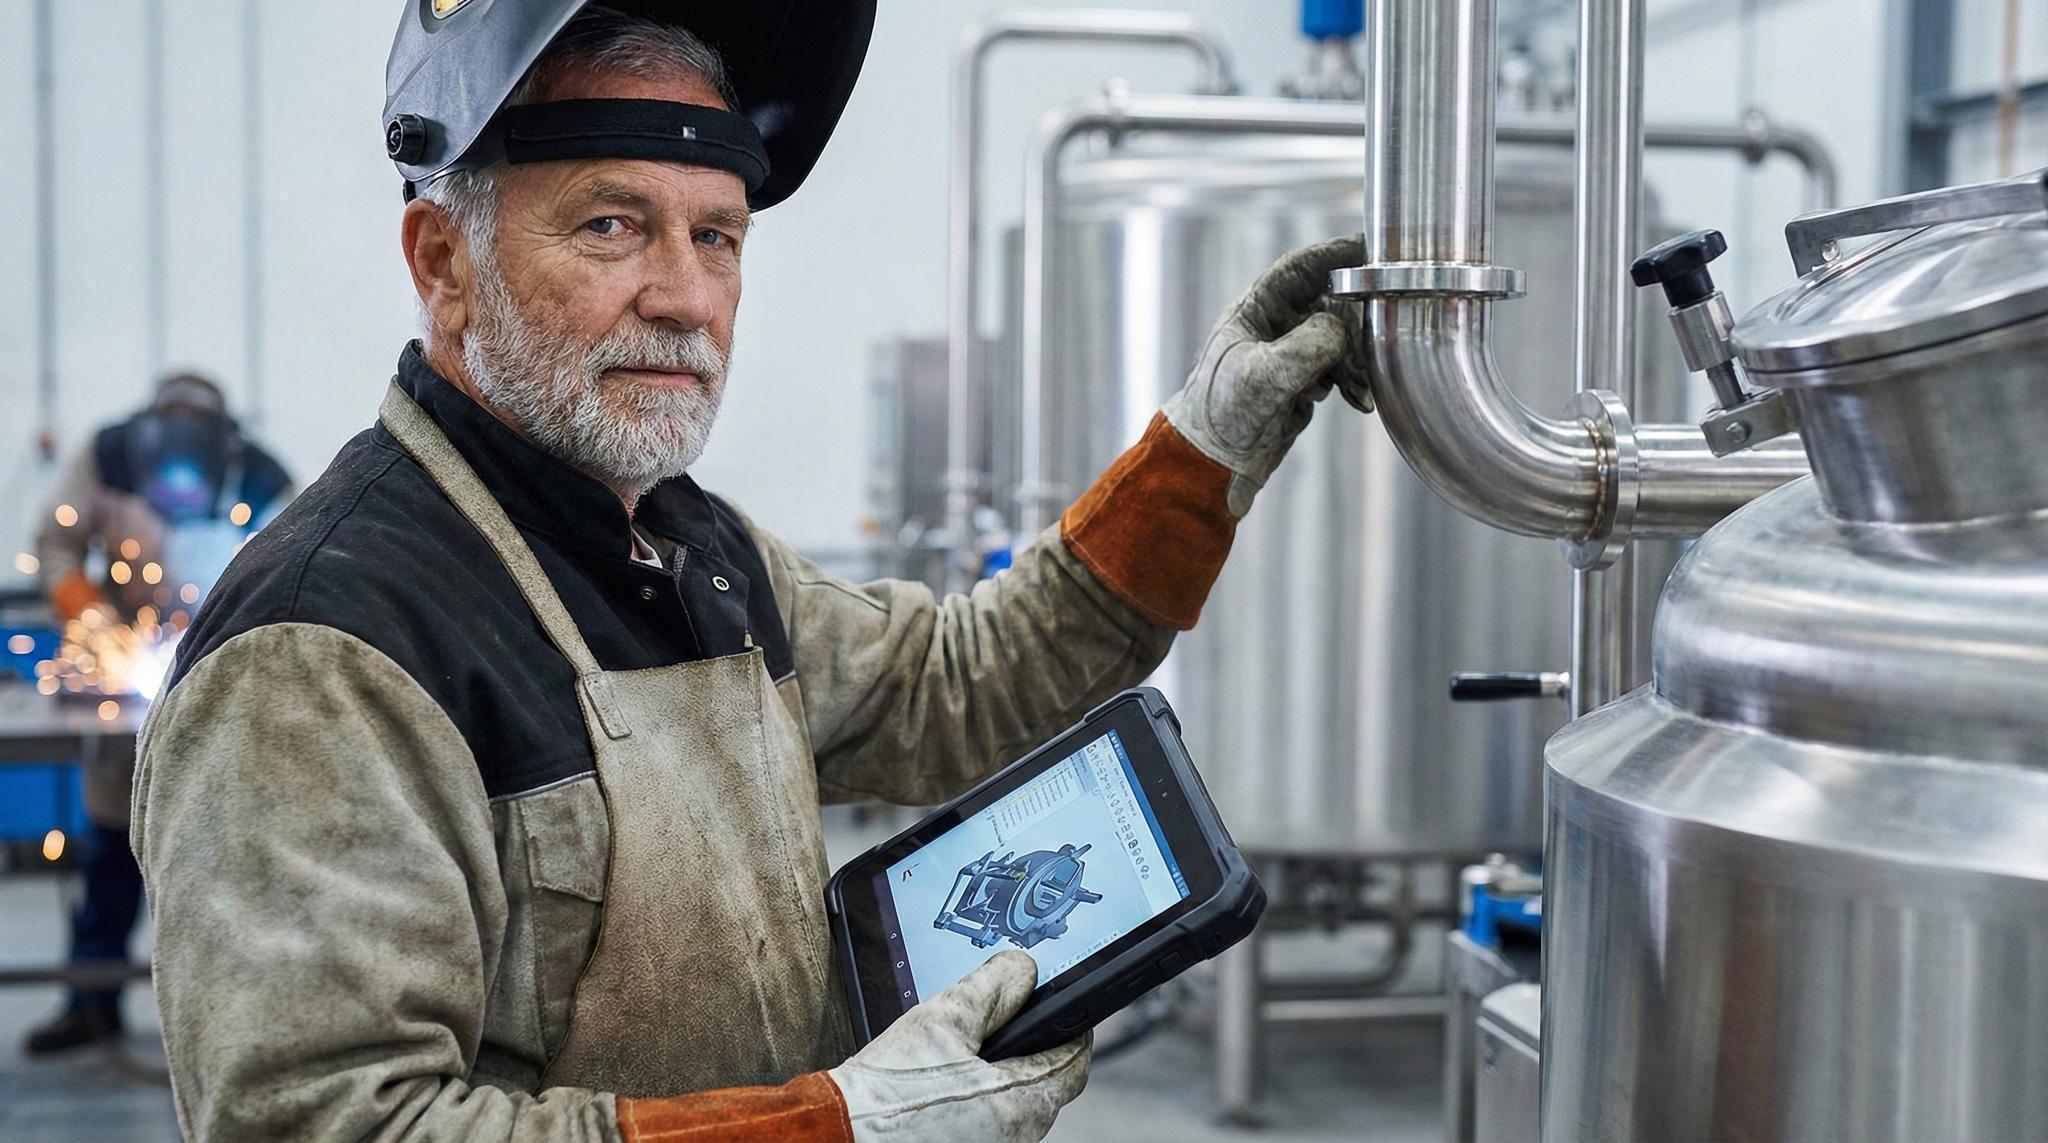
Consider Marcus, a senior welder on the fabrication floor.
Marcus builds stainless-steel product-contact piping. This scenario assumes he TIG-welds custom assemblies with variable geometry. FDA rules require food-plant equipment to be adequately cleanable and its food-contact seams to be smoothly bonded or maintained so residue does not accumulate. 3-A hygienic-design guidance says continuous welds that are smooth and crevice-free can be cleaned, while skip welds can leave crevices that harbor product and bacteria.39
Software may help specify or inspect a weld, but this example does not assess a particular robot or its economics. The constructed profile assigns this variable custom-welding work to the human-led portion of the model.32
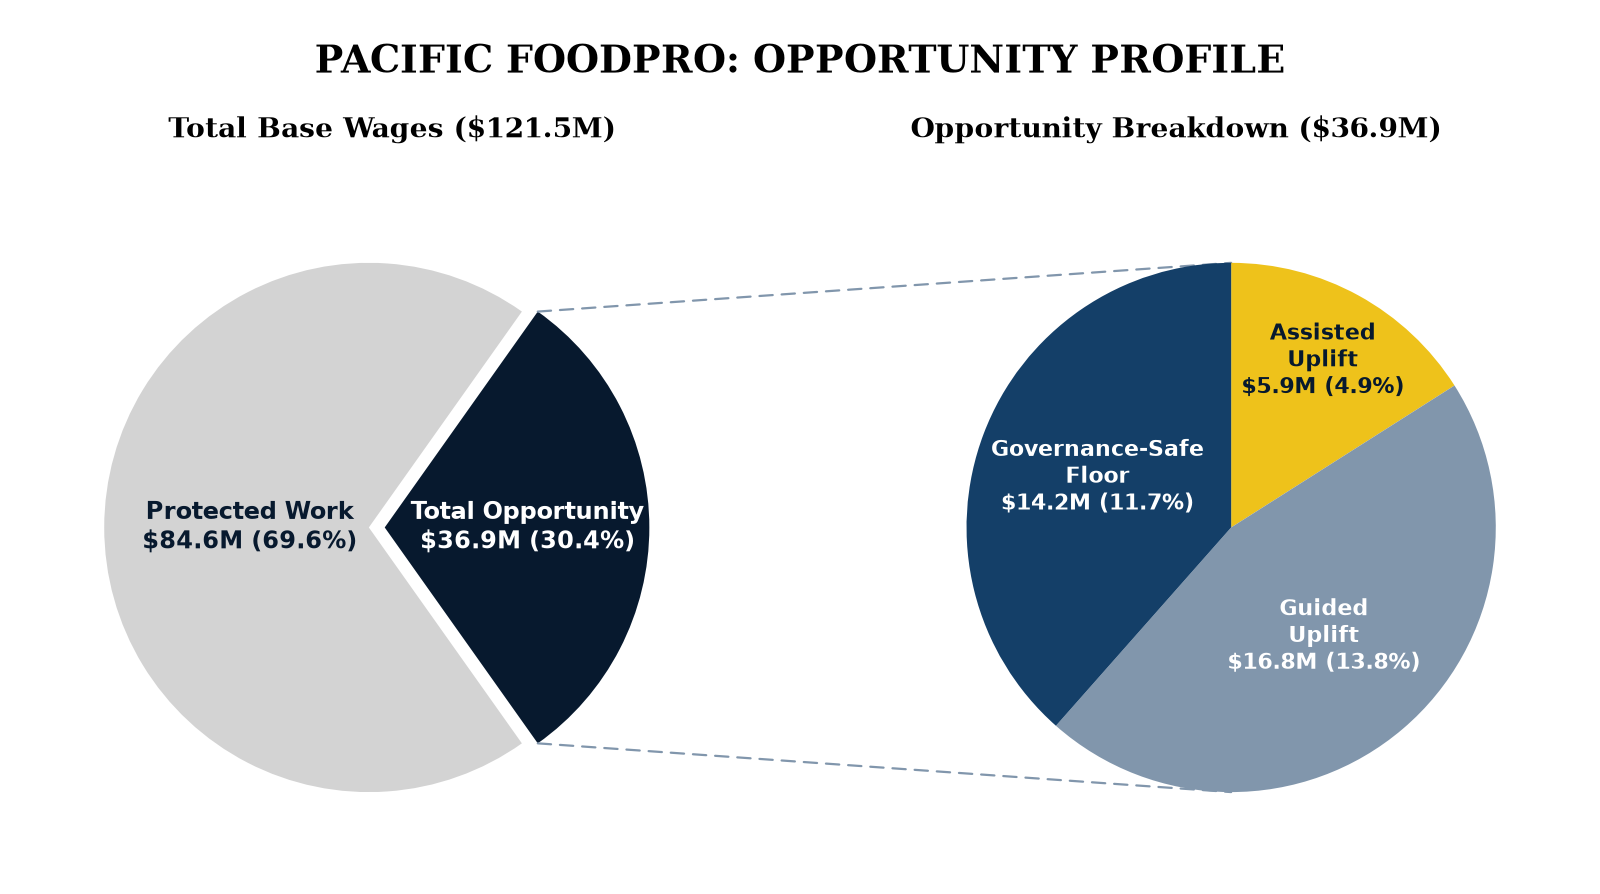
Figure 5: Pacific FoodPro: AI Opportunity Profile
Base wages: $121.5M | 1,361 employees | Fictional custom equipment manufacturer, Pacific Northwest
In this constructed profile, the model assigns 13.8% of wages to Guided Uplift and 11.7% to the Governance-Safe Floor. These are profile-level model outputs, not estimates for manufacturing as a sector.5,32
Pacific FoodPro’s engineers do not need AI to replace Marcus. They need AI to help them design systems faster, troubleshoot more efficiently, and produce documentation that used to take days or weeks. The factory floor stays human, but the humans have better data faster. The opportunity lies in augmenting the engineers and operators who manage the physical systems.
The question for Pacific FoodPro’s leadership: Will they invest in AI fluency for their engineering and operations teams, or assume manufacturing is “safe” from AI and miss the engineering augmentation opportunity entirely?
Part 5: Why Most Managers Will Struggle
Based on our analysis of the national labor force and the constructed profiles, the efficiency gain from AI delegation is real and substantial. Where and how to introduce AI safely is clear.
The four failure modes below are risks inferred from the model and cited evidence. They are not estimates of how often managers make these mistakes.
Failure Mode 1: Confusing Coordination with Core Work
Asana estimated that knowledge workers spend 58% of their time on work about work, while Microsoft’s Microsoft 365 activity analysis says 60% of time within its apps went to email, chats, and meetings.30 The measures differ, and neither estimates what share of an organization’s coordination work AI can safely remove.
Most managers do not see it that way. They look at their marketing team and think “AI can write copy.” They look at their analysts and think “AI can build models.” They look at their engineers and think “AI can write code.” They go straight for core work, the visible, valued, identity-defining work everyone cares most about.
This is backwards. Core work is where governance constraints bind hardest. Verification is more expensive. Errors cost more. Accountability is less clear. Going straight for core work means going straight for the hardest problems in AI adoption.
Meanwhile, coordination work stays out of view: meeting scheduling, status emails, document search, calendar management, travel booking, and expense reporting. Errors may be reversible and verification may be cheap, depending on the workflow.
Managers who succeed start with coordination. They give people tools to reclaim the overhead tax before they touch the work people care about.
Failure Mode 2: Training for Compliance Instead of Fluency
Training built only around rules against unsafe use can leave workers without task-level guidance. One possible response is avoidance: staff hear about risks but get few examples of appropriate use. Another is overconfident use: workers treat a list of prohibitions as complete guidance and produce low-substance material that shifts review work to colleagues. The Harvard Business Review article describes this kind of output as “workslop.” It does not measure how common this response is across workplaces or its net productivity effect.40
Prompt libraries and one-off webinars may also fail to provide practice in specific workflows or a way for teams to compare output quality. This is a training recommendation, not a measured causal result.
In the second half of a six-month randomized Microsoft 365 Copilot experiment across 66 firms and 7,137 knowledge workers, the 80% of treated workers who used Copilot spent two fewer hours a week on email and worked less outside regular hours. Researchers detected no shift in task quantity or composition from individual-level access. The study did not observe all work or show where workers spent all the time saved.41
“Workslop” describes a risk of shifting review work to recipients. The cited article does not establish general effects on meeting preparation or decision speed.40
Managers who succeed train for productive fluency. They teach people to use AI well, not just safely. Executive leaders serve as visible exemplars by using the tools in their own daily work rather than delegating exploration. Successful organizations show what good looks like in specific workflows, measure output quality rather than volume, and institute feedback mechanisms to rapidly propagate effective patterns and interdict unproductive ones.
Failure Mode 3: Tone-Deafness to Workforce Anxiety and Agency
Workforce concerns about agency and job security may affect adoption, but the sources cited here do not measure how often or through what behavior. Berrey’s essay offers a qualitative account of those concerns. It is not a population estimate.42
When executive communication frames AI adoption exclusively in terms of headcount reduction, dramatic cost cuts, or ruthless efficiency, workers hear an existential threat. They reasonably conclude that cooperating with AI deployment is participating in their own replacement. Anxiety intensifies when distillation is perceived as a mandate to compress remaining human roles into relentless, high-intensity judgment work with no downtime.
In a Workday-sponsored survey of 2,950 full-time decision-makers and software implementation leaders, 75% said they were comfortable working with AI agents, while 30% were comfortable being managed by one. The result measures stated comfort in this survey. It does not establish why workers resist AI management or how they behave at work.42
Managers who succeed build psychological safety and preserve human agency. They articulate clear reinvestment destinations for reclaimed capacity, reassuring teams that efficiency gains fund growth and higher-value services rather than immediate job destruction. They engage employees directly in redesigning their own workflows, ensuring AI acts as a lever in their hands rather than a mechanism of surveillance or displacement.
Failure Mode 4: Chasing Moonshots Before Building Confidence
The business press is full of AI transformation stories. Massive cost savings. Breakthrough capabilities. Competitive moats. The pressure to do something big is intense.
Managers may therefore consider high-risk use cases first: AI customer service that handles complex complaints, automated underwriting that makes lending decisions, or algorithmic hiring that screens candidates. These uses can create consequential failures and regulatory scrutiny. Workday faces pending discrimination claims involving its hiring software, and the court has not found liability.9 Klarna’s public accounts describe a later shift toward hybrid customer service after its AI assistant launch.36
These are the wrong places to start. Some are excellent use cases, eventually. But they require organizational capabilities that do not exist yet: verification processes that have not been built, governance that has not been tested, cultural confidence that has not been earned.
Managers who succeed start simple. They build verification on low-stakes work. They earn confidence through demonstrated success. They establish governance that can scale. Then, and only then, they move up the risk curve. By the time they attempt the moonshots, they have the infrastructure to execute them.
The Minority Who Will Succeed
McKinsey’s annual survey identifies AI high performers, the organizations attributing at least 5% of earnings to AI and describing its impact as “significant.” They were 6% of respondents in 2025 and 6% again in 2026.35 What separates them has not changed much, but the gaps have.
They have reinvestment intent before they deploy. About 80% of all respondents pursue efficiency gains from AI. High performers also report pursuing growth (74% against 47% of others) and innovation (65% against 49%). The survey measures stated goals, not whether firms reinvest freed capacity. Leaders should decide where to use that capacity before deployment. Otherwise, efficiency may not translate into growth or innovation.35
They redesign workflows, not just tools. Nearly three quarters of high performers report “fundamentally redesigning” workflows because of AI, up from 55% a year earlier, against about a quarter of everyone else. They do not add AI to existing processes. They rethink where the human-AI boundary should be.35
They concentrate investment. High performers are more than twice as likely as others to spend over 15% of their information-technology budget on AI, and 3.3 times as likely to intend to transform their business with it within three years. That commitment funds the verification architecture, training, and governance that make deployment sustainable.35
They understand the difference between exposure and deployment. Our model estimates that 92% of U.S. wage mass has technical AI exposure, while 15.7% falls in its governance-safe floor.5 The McKinsey survey does not test whether high performers follow this specific model. The management recommendation is ours.
They use AI to amplify human judgment rather than replace it. High performers recognize that delegation is only the first, most obvious move: handing off routine, high-volume tasks that machines can process deterministically. The enduring competitive advantage lies in amplification: using AI as a cognitive sparring partner to extend the reach, speed, and depth of human judgment. They encourage professionals to use AI to pressure-test assumptions, explore alternative hypotheses, and surface edge cases, elevating the quality of decisions rather than merely accelerating execution. By treating AI as a lever that magnifies human capability rather than a substitute that displaces it, they turn reclaimed capacity into superior work.
The model estimates total national opportunity at about $3.24 trillion.5 How much firms capture depends on their investments and deployment choices. This paper does not estimate a firm-level capture rate.
Beyond Efficiency: The Field-Reshaping Horizon
This paper focuses on what organizations can deploy under current governance constraints. A separate strategic question is whether AI can change how an industry coordinates work. Sangeet Paul Choudary develops this argument in Reshuffle: Who Wins When AI Restacks the Knowledge Economy.43
Choudary argues that AI may change coordination mechanisms and control points across industries. Uber Freight’s public materials describe digital load matching and freight-management tools. This is an example of a platform coordinating parts of trucking, not evidence that every firm can reset an industry’s rules.43
Most organizations are not yet equipped to reshape their industries. They lack the fluency, the operating leverage, and the confidence to make such bets. But they should not ignore the horizon.
The path to field reshaping runs through operational fluency. Efficiency gains from the governance-safe floor today fund more ambitious transformation tomorrow. Experience with delegation boundaries, verification systems, and human-AI collaboration builds the intuition reshaping requires. Firms do not become reshapers by announcing a transformation initiative. They become reshapers by building the operational capability that makes transformation executable.
Leaders who capture the governance-safe opportunity while keeping the reshaping horizon in view will be positioned to act when their fluency and resources allow. Those who treat efficiency as the end goal will optimize their way to irrelevance.
The Employment Arc: Reorganization and an Uncertain First Rung
Historical cases show that automation can change tasks without eliminating an occupation. Bessen says ATMs changed tellers’ work from cash handling to marketing, but did not eliminate bank tellers. That example does not establish AI’s future employment effects.38
Evidence through mid-2026 does not establish that AI generally creates jobs or that it has caused widespread job elimination. Danish administrative data show no detectable change in earnings or hours two years after ChatGPT, while task reorganization inside adopting workplaces was widespread.33 In a U.S. study, firms with the heaviest AI spending grew headcount by about 10% over two years, including 12% at entry level. Those firms were already larger, faster-growing, and more technical, so the result is an association.34 The Census supplement reports AI-related headcount reductions at 2% of AI-using firms.4 McKinsey’s 2026 survey found 14% of respondents at AI-using organizations reported AI-related workforce reductions in the prior year, while 32% of respondents in the 2025 survey had expected such reductions. The survey figures are not a comparison of the same firms over time.35
One descriptive gap has emerged. In ADP payroll data through June 2026, employment of 22- to 25-year-olds in the most AI-exposed occupations was 19% below the level it would have reached if it had tracked less-exposed peers. The gap primarily reflects reduced hiring, attenuates when the authors control for education, and partly predates generative AI. The authors describe it as an early indicator, not a causal estimate.16 Anthropic’s labor-market study found the job-finding rate for young workers in exposed occupations down about 14% from 2022, a result the authors call just barely statistically significant.44 Goldman Sachs reports employment and unemployment headwinds in occupations exposed to substitution and says junior workers may face greater hiring headwinds. These findings are observational and do not establish that AI caused the changes.20
A separate New York Fed analysis uses a back-of-the-envelope calculation to estimate that remote work explains 64% of the increase in unemployment among young college graduates between 2017-19 and 2022-24. The shift to remote work predates generative AI. This estimate concerns aggregate graduate unemployment, not the occupation-specific employment gap in the ADP study.45 The two studies examine different populations and outcomes, and neither establishes that AI caused the gap or that remote work fully explains it.
One possible interpretation is that junior roles include a larger share of codified, routine, digital tasks, which the model places nearer its governance-safe floor, while senior roles more often include judgment and accountability. The employment studies do not measure that mechanism. If organizations automate junior tasks without redesigning entry-level roles, they may compress the bottom of the ladder before eliminating senior positions.5,19
A policy and management question is how organizations can redesign entry-level work as tasks change. The evidence reviewed here does not show which interventions will preserve entry paths or produce job growth.
The Opportunity to Make Work More Human
AI can reduce repetitive work and leave more time for judgment, care, and initiative. Whether that time reallocation changes the job depends on what employers do with it. It doesn’t happen automatically. Managers have to thoughtfully redesign work to focus it on the things that make work enjoyable and fulfilling for workers.
We are starting to see real-world examples of AI reshaping work in positive ways. At a UK flood-risk company, AI automated the vast majority of manual quality-control checks on flood maps. Workers took on more research, planning, and project management. One worker told the OECD that the job had become more interesting and enjoyable.46
At UW Health, a 24-week randomized trial with 66 practitioners found that an ambient AI scribe cut note-writing time by about 22 minutes per eight hours of patient time. The combined work-exhaustion/interpersonal-disengagement score fell by 0.44 points on a five-point scale. The trial did not significantly increase professional fulfillment, and it did not provide a complete accounting of how clinicians used the time saved.46
These findings separate task relief from job redesign. In the flood-risk case, workers took on different work, while the Copilot trial found no shift in task quantity or composition from individual access.41 Leaders decide what fills the hours AI frees. That’s worth careful consideration.
Part 6: Implications for Governance and Risk
The cited insurance materials show AI exclusions in some standard policy forms and several announced specialty products. Some product materials describe technical review or governance criteria. They do not establish how consistently those criteria affect underwriting or pricing, or how the market’s terms affect AI adoption.10,11,12,13,14
To establish stable operational conditions for AI adoption, risk managers, corporate directors, and regulators should focus on seven immediate priorities:
Publish attachment data. The filing evidence does not show how many commercial policies carry AI exclusions at renewal. Requiring carriers to report attachment rates would let buyers assess how often filed exclusions are used in issued policies.10
Require affirmative carriers to state their conditions. Product materials should disclose whether coverage depends on technical review or governance evidence, and identify the controls considered. The public announcements reviewed here do not support a market-wide comparison of underwriting conditions.12,13
Clarify what is insurable. The policy forms reviewed here do not establish how coverage should treat low-consequence, deterministic workflows. Regulators and carriers should test coverage language against concrete use cases before offering broad assurances about which categories fit standard policies.10,11
Define governance requirements for lower-delegation work. Establish what active review and assisted preparation require in specific professional settings. The Hamm case concerns a chatbot’s misleading commercial claim, while Mobley v. Workday concerns discrimination claims involving hiring software. Neither case sets a general standard for clinical or legal professional liability.8,9
Set explicit requirements for Human-Only contexts. Define testing and safety requirements before authorizing autonomous systems in safety-critical settings. Verisk says it is evaluating optional language for additional agentic-AI exposures. That report shows policy wording is under consideration, not that the underwriting market has agreed on a particular distinction.14
Account for compliance costs and shifting timelines. A 2021 study commissioned for the European Commission’s impact assessment of its proposed AI regulation estimated €29,277 in annual compliance costs per average AI product, including external data, services, and added staff. It estimated €16,800 to €23,000 for an EU-type conformity assessment. These are ex ante model estimates under a proposal, not observed costs under the law now in force.47 The Digital Omnibus on AI moved the application date for standalone high-risk systems to December 2027 and for high-risk AI embedded in regulated products to August 2028. Article 50 transparency duties began on August 2, 2026. Providers of systems already on the market before that date have until December 2, 2026 to meet the content-marking requirement.48
Mandate AI governance training for licensed professionals. Require licensed professionals (including physicians, engineers, attorneys, and brokers) to maintain continuing education on AI failure modes, algorithmic bias, and verification accountability. You cannot govern what you do not understand.
About This Research
Building from the Labor Department’s O*NET task and occupation database, we developed an expanded task-level database covering 18,898 tasks that define 848 jobs held by about 148 million U.S. workers. We sorted tasks by their centrality to the role and assigned delegation categories.
The assessment protocol used a four-model review (Gemini, ChatGPT, Claude, and Llama). It reports Fleiss’ kappa of 0.81 for AI-system classification and Cronbach’s alpha of 0.88 for delegation-potential scoring.49 These are internal agreement and consistency measures. They do not establish construct validity or predictive validity.
We used BLS OEWS May 2024 wages to calculate the wage share corresponding to each task. Task classifications were completed in December 2025. The task inventory uses O*NET Release 30.0, published in August 2025 by the Labor Department’s Employment and Training Administration. O*NET is not a BLS product. O*NET 31.0 followed in August 2026, and BLS released May 2025 OEWS estimates in May 2026.6 We compared both vintages with the inputs used in the model. Of the 13,643 O*NET tasks scored, 97.7% were unchanged in 31.0: none were reworded, 14 were withdrawn, and 298 were reclassified from Core to Supplemental. Rebuilding on 31.0 would reduce the inventory by 1.9%. The departing tasks carry 1.3% of national wage mass and would move the governance-safe floor by 0.37 percentage points before adding 48 new Core tasks. Against May 2025 wages, the governance-safe floor moves from 15.75% to 15.62% and the total from 31.92% to 31.81%. Both changes are within the companion’s 0.4-point weighting sensitivity band, so this edition reports the January figures unchanged. The vintage comparison scripts and results are preserved with the project.50,5
We tested the task scores against published use. Anthropic’s Economic Index reports how often each O*NET task appears in its models’ usage, subject to a privacy threshold. We matched 13,643 scored tasks by O*NET task identifier. The other 5,255 tasks in our expanded inventory have no O*NET identifier because they were added for occupations without task lists or for coordination work. The companion reports the full method and results. The test corroborates the ordering of tasks in this one vendor’s self-selected usage data. It does not validate the dollar estimates or measure governed enterprise deployment.15,5
National numbers represent typical organizations, not best-in-class. Guided and Assisted layers are reported as scenario ranges because results depend on governance maturity and risk tolerance.
The method scales from firm-level delegation mapping to state-level economic analysis to national labor-market modeling. We applied it at state scale in Utah’s AI Workforce Reality (April 2026), covering 1.6 million workers and 20 named employers.51 That report is a geographic application of this model, not a second set of national figures. The approach extends to any economy with occupational task data.
We welcome collaboration with partners committed to joint research and implementation. Our enriched O*NET database (848 occupations and 18,898 tasks combined with BLS OEWS data), along with the full technical method, is available to engaged partners. Send inquiries to [email protected].
Suggested Citation: Seampoint LLC. (2026). The Distillation of Work: Where AI Opportunity Concentrates and How Leaders Capture It, September 2026 Edition.
This research was conducted independently and funded by Seampoint. The Seampoint management team has no concentrated financial interest in any AI vendor or any firm mentioned in this report.
© 2026 Seampoint LLC. All rights reserved.
About Seampoint
Seampoint is a research and advisory firm built on the insight that value concentrates at the seam points, the boundaries where human authority meets AI capability. Well-designed seams let firms gain the most from AI while managing the risk.
We help firms build lasting advantage by identifying where AI delegation is appropriate, suggesting proven design patterns for specific AI technologies, designing governance protocols for safe delegation, and building the workforce fluency required for breakthrough performance on both sides of the seam.
Appendix: Changes from the January 2026 Edition
The model, the task database, and the council classifications are as published in January 2026. The dollar figures in Part 3 are those January figures, printed as the rounded tiers. The unrounded database total is $3.25 trillion, 31.92% of wages. Figure 2 is new. The four opportunity charts were rebuilt for this edition: the middle tier is labeled Guided, and the physician section shows the KaleidoHealth chart. We re-measured the governance-safe floor against newer data. It moves 0.14 percentage points against May 2025 wages and 0.37 against O*NET 31.0. Both sit inside the 0.4-point band reported in the companion, which is why this edition does not re-run the model. The field test corroborates the ordering of tasks. It does not validate the dollar figures. The changes below are to the evidence and the argument around the numbers.
| Section | What changed | Why |
|---|---|---|
| Executive Summary | The gap is now stated with worker-based figures: 80% of workers exposed vs. 32% of employment at firms using AI. Before, it was "80% of workers vs 17% of businesses." Part 1 adds the 41% figure for firms where workers use AI in their tasks. | The first edition compared a share of workers with a share of firms. The Census Bureau's 2026 supplement supplies figures that compare like with like |
| Executive Summary | Air Canada is named alongside Hamm and Workday as legal signals, and the Workday ruling is described as pleading-stage only. The usage finding is clarified, and distillation is defined around role composition. The 22- to 25-year-old employment gap is described as correlational. | This gives the full legal picture and matches the employment evidence in Part 5 |
| Part 1 | Census series updated (17% Dec 2025 to 20% May 2026); depth-of-use figures added; Anthropic usage figures added | New data |
| Part 1 | The Anthropic Institute’s scenario model (September 2026) added: it anchors its deployment parameter on the same Census figures; its three scenarios are placed as the forecast range; its deployment share is named as an assumed input; its public survey is cited | Independent convergence on the employment-weighted reading. The framework leaves the deployment ceiling unexplained, which is the claim this paper makes |
| Part 1, Converging Evidence | Liability: Air Canada (2024), Hamm (May 2026) and Workday (June 2026) rulings presented chronologically; “regulatory penalties” replaced with the case | Complete legal posture |
| Part 1, Converging Evidence | Verisk cited as the client of all of the top 100 U.S. P&C insurers (2025 annual report). The 90% of premium volume is Verisk’s claims database (2024 Form 10-K), not its policy forms. Spurious 80% form-usage claim stays out. Language on pricing and information asymmetry clarified | An earlier draft attached both figures to forms and cited a July 20, 2026 Morningstar note that does not contain them |
| Part 2, Constraints | Game-industry pushback cited to named removals, the 2025 performers’ agreement, and the January 2026 industry survey. Humanoid paragraph rewritten: demonstration moves remote-controlled (Elluswamy, September 20, 2026); Tesla factory use not material (earnings call, January 28, 2026); Figure and Agility pilots reported as hours and counts, with no published customer return | The first wording of this paragraph claimed industry-wide tool withdrawals and that no humanoid was doing useful work. Those sentences did not survive the sources |
| Part 3, The National Opportunity | Dedicated subsection defines Core Work versus Coordination Work and gives separate measures for coordination time. The model’s coordination estimate is identified as an opportunity under assumptions, not as evidence that every coordination task is safe to automate | Restores the methodological foundation before opportunity calculations and preserves the survey limits |
| Part 3, Field Validation | “Testing the Scores: What Real Use Shows” moved from Part 1 to Part 3. Match rates stated by channel: 78% of published chat tasks and 79% of published API tasks; matched tasks are 76% of chat usage and 69% of API usage. Dollar totals stated as rounded tiers ($3.24 trillion, 31.8%) against the unrounded database total ($3.25 trillion, 31.92%) | The body had collapsed the match into “three quarters of published usage,” and had printed the rounded sum as if it were the database total |
| Part 4 | Distillation defined explicitly around role composition (tasks migrate, existing work expands, supervision arrives, judgment concentrates); Danish records clarified as ruling out earnings/hours cuts >2%; “evaporated” and “purified” rhetoric retired | Eliminates false impression that distillation means jobs disappearing |
| Part 5 | Expanded failure modes: Mode 2 covers one-shot training limits and feedback loops; Mode 3 covers tone-deafness to workforce anxiety and agency; Mode 4 covers moonshots; Minority Who Will Succeed adds judgment amplification bullet | Directly addresses organizational enablement, psychological safety, and Seampoint’s amplification framework |
| Part 5, Employment Arc | Historical automation is a qualified analogy; near-term workforce evidence is bounded, and the longer-run job balance remains unknown | The cited evidence does not establish that AI generally creates jobs |
| Part 6 | Retitled “Implications for Governance and Risk”; state economic development section removed to focus on executive risk and regulation; insurance and liability priorities retained | Sharpens paper’s focus for enterprise operators, risk officers, and regulators |
| Part 1, forecasts and legal cases | Goldman Sachs baseline updated to the 9% ten-year reallocation estimate; Anthropic’s 10% diffusion parameter separated from its economy-wide task-instance share; court rulings distinguished from a pending vendor case | Corrects changed estimates and limits the claims to what each source establishes |
| Part 2, constraints | Clinical accountability scoped to AMA guidance; consumer-response results tied to their samples; X-ray rotation corrected to 30 minutes; robotic payback claim removed | Replaces general claims with bounded evidence |
| Part 3, coordination and productivity | Asana and Microsoft measures separated; task-study results stated individually; unsupported supplier-induced-demand sentence removed | Preserves each study’s population, task, and measure |
| Part 4, workforce profiles | Company sizes and staffing mixes identified as constructed inputs; teller, physician, and welding claims revised to separate evidence from scenario assumptions | Makes the fictional inputs and their limits explicit |
| Part 5, Failure Mode 2 and The Opportunity to Make Work More Human | Copilot results corrected to the AEA abstract’s email-time and task-mix findings; unsupported 7%/18% email-reading claims removed. Replaced the TSA example with the OECD flood-map case and UW Health randomized AI-scribe trial | Separates measured time savings from job redesign and supports a conditional claim about work becoming more human |
| Part 6, EU compliance | 2021 proposed-Act cost estimates labeled as modeled; Digital Omnibus dates and the December 2026 marking transition stated | Separates historical estimates from current law |
| About This Research | Field-validation paragraph added; Utah state application named and linked; data vintages and sensitivity measurements detailed | Full methodological accounting |
| Companion document | Section 1.1 restated with 2026 adoption and usage figures; section 5.5 dated; section 5.6 (field validation) added; sections 9.3 and 10.2 amended | Aligns methodology companion with second edition |
Notes and Sources
[1] Eloundou, T., Manning, S., Mishkin, P., & Rock, D. (2023). “GPTs are GPTs: An early look at the labor market impact potential of large language models.” arXiv. https://arxiv.org/abs/2303.10130
[2] McKinsey Global Institute. (2023). “The economic potential of generative AI.” McKinsey & Company. https://www.mckinsey.com/mgi/our-research/the-economic-potential-of-generative-ai-the-next-productivity-frontier
[3] U.S. Census Bureau, Business Trends and Outlook Survey. Grundy, A., Breaux, C., & Khatiwoda, D. (2026, May 26). “Large Firms With at Least 20 Employees Biggest AI Users.” Survey question: “Does this business currently use AI in any of its business functions?” https://www.census.gov/library/stories/2026/05/ai-use-businesses.html
[4] Bonney, K., Breaux, C., Dinlersoz, E., Foster, L., Haltiwanger, J., & Pande, A. (2026). “The Microstructure of AI Diffusion: Evidence from Firms, Business Functions, and Worker Tasks.” U.S. Census Bureau, Center for Economic Studies Working Paper CES-26-25. Reference period November 2025 to January 2026. https://www2.census.gov/library/working-papers/2026/adrm/ces/CES-WP-26-25.pdf
[5] Seampoint LLC. (2026). Workforce Friction Model, September 2026 edition. Replication data: replication/usa/workforce_friction.db; methods and estimates: notebook/00_White_Paper/Seampoint_The_Distillation_of_Work_Methodology_Companion_Document_Sep2026.md. This is an internal analytical source; its outputs are estimates, not observed employer results.
[6] U.S. Department of Labor, Employment and Training Administration, O*NET 30.0 task and occupation data; U.S. Bureau of Labor Statistics, Occupational Employment and Wage Statistics, May 2024, local workbook notebook/04_Data_Sources/national/bls/oesm24nat/national_M2024_dl.xlsx. The BTOS time series used for footnote 3 is preserved at notebook/04_Data_Sources/national/census/National-BTOS.csv and .xlsx.
[7] Moffatt v. Air Canada, 2024 BCCRT 149. BBC News. (2024). “Air Canada chatbot promised a discount it couldn’t deliver.” https://www.canlii.org/en/bc/bccrt/doc/2024/2024bccrt149/2024bccrt149.html
[8] Higher Regional Court of Hamm (Oberlandesgericht Hamm), judgment of May 12, 2026. No official judgment copy is archived here. See Library of Congress, Global Legal Monitor (2026, June 9), “Germany: Court Rules Chatbot Operators Are Liable for AI Hallucinations,” and a third-party full-text republication at NuLegal. https://www.loc.gov/item/global-legal-monitor/2026-06-09/germany-court-rules-chatbot-operators-are-liable-for-ai-hallucinations/; https://recht.nulegal.eu/rechtsprechung/olg-hamm/2026-05-12/4-ukl-3-25
[9] Mobley v. Workday, Inc., N.D. Cal., order of June 22, 2026 on the Third Amended Complaint. The July 12, 2024 order allowed a disparate-impact claim to proceed on allegations that Workday acted as an employer’s agent; the June 2026 order allowed some amended California-law and Americans with Disabilities Act claims to proceed at the pleading stage. It dismissed an unauthorized race claim and a direct-employer theory. Neither order determined liability. The 2026 order is listed on the Civil Rights Litigation Clearinghouse docket but is not archived locally. https://clearinghouse.net/case/44074/; https://blogs.duanemorris.com/classactiondefense/2026/06/24/california-federal-court-grants-in-part-and-denies-in-part-workdays-motion-to-dismiss-in-mobley-v-workday/
[10] Macgregor, M., & Gale, H. (2026, July 23). “More than 60 P&C insurance groups file to adopt AI exclusions.” The Insurer. The article says it reviewed nearly 10,000 filings through S&P Capital IQ; its underlying filing dataset is not archived here. It found subsidiaries of 41 groups had filed to adopt exclusions and subsidiaries of 20 others had filed to delay adoption. For the separate approval statistic, see Allen, G. C. (2026, September 4), Center for Strategic and International Studies, reporting Wolfe Research data that state insurance commissioners had approved more than 80% of carrier requests as of April 23, 2026. https://www.theinsurer.com/ti/analysis/more-than-60-pc-insurance-groups-file-to-adopt-ai-exclusions-2026-07-23/; https://www.csis.org/analysis/insurance-industrys-retreat-ai-threatens-slow-innovation-and-adoption/
[11] W. R. Berkley, absolute AI exclusion, form PC 51380. Language quoted in Policyholder Pulse (2026, April 13), “AI Exclusions in Insurance Policies: Broad Language, Uncertain Impact.” https://www.policyholderpulse.com/ai-exclusions-in-insurance-policies-broad-language-uncertain-impact/
[12] Examples from company announcements, not a complete market census: Armilla’s Lloyd’s-backed AI liability policy (April 30, 2025); Testudo’s standalone AI liability insurance (January 21, 2026); Chaucer/Armilla’s Vanguard AI structure (February 10, 2026); Mosaic’s aiSure partnership (February 26, 2026); HSB’s small-business AI liability coverage (March 18, 2026); and Mayflower/Hadron’s affirmative program (June 24, 2026). The Vanguard announcement states dedicated AI limits of $25 million or more. Munich Re describes technical due diligence in its aiSure materials. Mayflower’s launch announcement describes underwriting for model bias, drift, and hallucinations using a scoring engine aligned with NIST and ISO standards; this is the company’s description. https://www.prnewswire.com/news-releases/armilla-launches-affirmative-ai-liability-insurance-with-lloyds-underwriter-chaucer-302442586.html; https://www.testudo.co/insights; https://www.chaucergroup.com/news/press-release-chaucer-and-armilla-ai-launch-vanguard-ai-coordinated-insurance-structure; https://www.mosaicinsurance.com/resources/press-releases/~/mosaic-partners-with-munich-res-aisure-to-provide-pioneering-coverage-for-ai-vendors/; https://www.munichre.com/hsb/en/press-and-publications/press-releases/2026/2026-03-18-introducing-ai-liability-insurance-for-small-businesses.html; https://www.businesswire.com/news/home/20260624288628/en/Mayflower-and-Hadron-Launch-the-First-Dedicated-Affirmative-AI-Liability-Program-in-the-US-Market; Munich Re aiSure white paper: https://www.munichre.com/en/solutions/for-industry-clients/insure-ai/ai-whitepaper.item-f4908b8a46398cbd7f6f4f0492e80308.html
[13] CFC. (2026, June). “CFC responds to customer demand for affirmative AI cover.” CFC says it added affirmative cover across seven product lines; the release quotes Nick Line, Chief Underwriting Officer. https://www.cfc.eu/en-gb/knowledge/news/2026/06/cfc-responds-to-customer-demand-for-affirmative-ai-cover/
[14] Macgregor, M. (2026, July 10). “Verisk weighs new exclusions for agentic AI risks.” The Insurer. Verisk says any additional exclusion language would be optional and left to each insurer. https://www.theinsurer.com/ti/news/verisk-weighs-new-exclusions-for-agentic-ai-risks-2026-07-10/
[15] Seampoint analysis of the Anthropic Economic Index, June 26, 2026 release (April-May 2026 usage), joined to the Seampoint task database by O*NET task identifier. Method and results are in the companion document, section 5.6. The June report PDF, data documentation, and the January, March, and June row-level data releases are archived under citations/anthropic-economic-index/. The CSV files are preserved as gzip-compressed originals; their source SHA-256 hashes are in citations/anthropic-economic-index/MANIFEST.md. The sample is one provider’s observed usage, not a representative sample of enterprise deployment. https://www.anthropic.com/research/economic-index-june-2026-report; data releases: https://huggingface.co/datasets/Anthropic/EconomicIndex
[16] Brynjolfsson, E., Chandar, B., & Chen, R. (2026, August 12). “Canaries in the Coal Mine? Six Facts about the Recent Employment Effects of Artificial Intelligence,” revised. Stanford Digital Economy Lab. ADP payroll data, November 2022 to June 2026. https://digitaleconomy.stanford.edu/app/uploads/2026/08/Canaries_August2026.pdf
[17] Korinek, A., Jones, C. I., Sacher, S., Cotter, T., & McCrory, P. (2026, September). “Economic Scenarios for Transformative AI.” The Anthropic Institute, Working Paper No. 2026-02. Their diffusion parameter counts task instances performed with AI; the economy-wide fraction of task instances completed with AI is affected-task share multiplied by diffusion. It is not comparable to the wage-mass shares in Part 3. The scenarios are not predictions and have no assigned probabilities. https://www.anthropic.com/institute/econ-scenarios
[18] Anthropic. (2026, March 24). “Anthropic Economic Index report: Learning curves.” The report states that about 49% of jobs had at least a quarter of their tasks performed using Claude. Local PDF: citations/anthropic-economic-index/2026_Anthropic_Economic_Index_Learning_Curves_March24.pdf. Anthropic. (2026, March 5; corrected March 8). “Labor market impacts of AI: A new measure and early evidence.” Local PDF: citations/anthropic-economic-index/2026_Anthropic_Labor_Market_Impacts_March5.pdf. https://www.anthropic.com/research/economic-index-march-2026-report; https://www.anthropic.com/research/labor-market-impacts
[19] Gates, B. (2026, August). “The turbulent AI era is here. The choices we make now are critical.” Gates Notes. https://www.gatesnotes.com/a-turbulent-ai-era-and-critical-choices-to-make
[20] Goldman Sachs Global Investment Research. (2026, June 25). “An AI Job Apocalypse?” Top of Mind, Issue 149. Its 9% figure estimates workers reallocated to new positions over ten years, not net job losses. The report page and interview transcript are online; attempted PDF downloads were HTML redirects and are not source copies. Goldman Sachs Research (2026, April 24) reports substitution-exposed employment declines and unemployment increases, with offsetting gains in some augmenting occupations. Its September 3 review says junior workers may face stronger hiring headwinds. https://www.goldmansachs.com/insights/top-of-mind/an-ai-job-apocalypse; https://www.goldmansachs.com/insights/goldman-sachs-exchanges/how-will-ai-impact-the-labor-market; https://www.goldmansachs.com/insights/articles/the-jobs-ai-is-likely-to-boost-and-those-it-may-disrupt; https://www.goldmansachs.com/insights/articles/is-ai-impacting-global-labor-markets
[21] Verisk/ISO, generative-AI exclusion endorsements CG 40 47, CG 40 48, and CG 35 08, edition date January 1, 2026; Verisk 2025 annual report says its clients include all top 100 U.S. P&C insurers for the lines of service offered. Verisk’s 2024 Form 10-K says its claims database represents approximately 90% of P&C premium volume; that figure describes the database, not the reach of its policy forms. The filings are online and were not copied to this source bundle. https://www.sec.gov/Archives/edgar/data/1442145/000143774926004452/vrsk20251231_10k.htm; https://www.sec.gov/Archives/edgar/data/1442145/000143774925005160/vrsk20241231_10k.htm
[22] BCG. (2025). “Insurance Leads in AI Adoption.”
[23] Acemoglu, D. & Restrepo, P. (2019). “Automation and new tasks: How technology displaces and reinstates labor.” Journal of Economic Perspectives.
[24] American Medical Association, “To implement health AI, first decide who’s accountable,” July 24, 2025. The AMA states that clinical decision-making must remain with clinicians. https://www.ama-assn.org/practice-management/digital-health/implement-health-ai-first-decide-who-s-accountable
[25] Originality.ai (2025). “Over half of long posts on LinkedIn are likely AI-generated since ChatGPT launched.” Its own detector classified 2,726 LinkedIn posts over 100 words; the comparison is observational and does not establish that AI use caused lower engagement. Raptive (2025). “AI Trust Study.” Survey of 3,000 U.S. adults; the cited 14% measure is purchase consideration for ads adjacent to content respondents suspected was AI-generated, not general consumer trust or conversion. Originality.ai: https://originality.ai/blog/ai-content-published-linkedin; Raptive survey coverage: https://www.adweek.com/media/ai-content-cuts-trust-hurts-ad-performance/
[26] Game Developers Conference. (2026, January). 2026 State of the Game Industry. Survey of more than 2,300 professionals (publisher-stated margin of error ±3 percent), with Omdia and the Game Developer editorial team. The 52-page survey PDF is archived as citations/2026_GDC_State_of_the_Game_Industry.pdf. In the generative-AI chapter, 52% said generative AI was having a negative impact, up from 30% in 2025 and 18% the year before; 16% said they were not allowed to use any such tools. Named removals: Frontier Developments, statement on Steam, reported by Cripe, M., IGN, June 24, 2025 (“We have opted to remove the use of generative AI for scientist portraits within Jurassic World Evolution 3”); Aspyr, hotfix of September 19, 2025, reported by Chalk, A., PC Gamer, September 24, 2025 (unauthorized AI voices removed from the Tomb Raider IV-VI remasters after objections from Françoise Cadol and Lene Bastos). Performers’ agreement: Reuters, July 9, 2025; SAG-AFTRA, 2025 Interactive Media Agreement, requiring informed consent and disclosure for digital replicas at Activision, Disney Character Voices, Electronic Arts, Insomniac, Take-Two, WB Games, and the other publisher signatories. https://reg.gdconf.com/2026-SOTI; https://www.ign.com/articles/frontier-developments-removes-generative-ai-art-from-jurassic-world-evolution-3; https://www.pcgamer.com/games/action/tomb-raider-iv-vi-remastered-hotfix-removes-ai-voices-after-actors-object/
[27] Svanberg, M., et al. (2024). “Beyond AI exposure: Which tasks are cost-effective to automate with computer vision?” MIT.
[28] Schneider, J., & You, L. (2026). “AI agents vs. humans: who costs more?” in Goldman Sachs, Top of Mind Issue 149 (see note 20). Simulated daily workloads; figures are estimates. https://www.goldmansachs.com/insights/top-of-mind/an-ai-job-apocalypse
[29] Elluswamy, A. (@aelluswamy). (2026, September 20). Post on X. https://x.com/aelluswamy/status/2101787431012110684. Tesla, Inc., Q4 2025 earnings call. (2026, January 28). Transcript, The Motley Fool. https://www.fool.com/earnings/call-transcripts/2026/01/28/tesla-tsla-q4-2025-earnings-call-transcript/. Figure AI. (2025, November 19). “F.02 Contributed to the Production of 30,000 Cars at BMW.” https://www.figure.ai/news/production-at-bmw. The hours and part counts are the vendor’s. Agility Robotics. (2025, November 20). “Digit Moves Over 100,000 Totes in Commercial Deployment.” https://www.agilityrobotics.com/content/digit-moves-over-100k-totes. Hours and customer list: Agility Robotics materials filed with the SEC in May 2026 as Exhibit 99.1 to Churchill Capital Corp XI, https://www.sec.gov/Archives/edgar/data/2074973/000121390026071290/ea029548401ex99-1.htm. That filing states that more than $300 million of Digit orders are not a measure of current revenue.
[30] Microsoft. (2024). “Work Trend Index Annual Report”; Asana. (2024). “Anatomy of Work Global Index.” https://www.microsoft.com/en-us/worklab/work-trend-index; https://asana.com/resources/anatomy-of-work
[31] Noy, S. & Zhang, W. (2023). “Experimental evidence on the productivity effects of generative artificial intelligence.” Science; Peng, S., et al. (2023). “The impact of AI on developer productivity: Evidence from GitHub Copilot.” arXiv. https://doi.org/10.1126/science.adh2586; https://arxiv.org/abs/2302.06590
[32] Seampoint constructed workforce maps and reports (December 22, 2025): notebook/99_Replication_Package/constructed_profiles/{ColdWest,KaleidoHealth,Pacific_FoodPro}/. Role maps use O*NET/SOC occupations and May 2024 BLS OEWS wage inputs (notebook/04_Data_Sources/national/bls/oesm24nat/national_M2024_dl.xlsx). The employer names, workforce sizes, payroll totals, branch or facility details, and role counts are scenario inputs. They are not reported by actual employers, and the maps do not independently validate industry staffing distributions.
[33] Humlum, A., & Vestergaard, E. (2026, March 13). “Still Waters, Rapid Currents: Early Labor Market Transformation under Generative AI.” RFBerlin Discussion Paper 078/26. Previously circulated as “Large Language Models, Small Labor Market Effects.” https://www.rfberlin.com/wp-content/uploads/2026/03/26078.pdf
[34] Kharazian, A., Simon, L., & Stevens, R. (2026, June 30). “A New Look at AI’s Impact on Jobs: Firm-Level AI Spending and Workforce Adjustment.” Ramp and Revelio Labs. 21,559 U.S. firms, January 2021 to February 2026. The result is an association; the paper notes that AI adopters were already larger, faster-growing, and more technical. Public summary and paper page: https://ramp.com/data/heavy-ai-adopters-hire-more; https://ramp.com/data/ai-jobs-impact
[35] McKinsey & Company. (2026, August). “The state of AI in 2026: On the road to ROI.” Survey of 1,719 participants in 97 countries, May 4 to June 8, 2026. The 14% is the share of respondents from AI-using organizations who reported AI-related workforce reduction in the prior year; the 32% is the share who had expected a reduction in the 2025 survey. https://www.mckinsey.com/capabilities/quantumblack/our-insights/the-state-of-ai
[36] Klarna’s 2024 company statement says its AI assistant handled two-thirds of customer-service chats in its first month and did work comparable to 700 agents; these are company-reported figures. The May 2025 Bloomberg Law article reports the chief executive’s quality concerns and hiring comments. Semafor reported Klarna’s June 2026 hybrid-service position. The Bloomberg item is not archived locally. https://www.prnewswire.com/news-releases/klarna-ai-assistant-handles-two-thirds-of-customer-service-chats-in-its-first-month-302072740.html; https://news.bloomberglaw.com/artificial-intelligence/klarna-rethinks-ai-cost-cutting-plan-with-call-for-real-people; https://www.semafor.com/article/06/09/2026/klarna-on-the-fight-for-top-of-wallet-in-an-ai-agentic-commerce-world
[37] American Bankers Association, 2024 Consumer Survey on Banking Methods, October 7-10, 2024, n=4,508 U.S. adults. 55% named mobile banking as their primary method, 22% online banking, 8% a branch, and 5% an ATM. This measures stated primary method, not transaction volume or historical branch traffic. https://www.aba.com/about-us/press-room/press-releases/consumer-survey-banking-methods-2024
[38] Bessen, J. (2015). Learning by Doing: The Real Connection Between Innovation, Wages, and Wealth. Yale University Press. The book is not archived; a Yale University Press interview with Bessen discusses how ATMs changed teller work. Autor, D. (2024). “Applying AI to rebuild middle class jobs.” NBER Working Paper No. 32140; local paper PDF. https://yalebooks.yale.edu/book/9780300195668/learning-by-doing/; https://yalebooks.yale.edu/2015/05/13/technology-and-wages-a-conversation-with-james-bessen/; https://www.nber.org/papers/w32140
[39] 21 CFR §117.40 requires food-plant equipment to be adequately cleanable and food-contact seams to be smoothly bonded or maintained to limit residue accumulation (2025 CFR PDF in citations/2025_CFR_21_117-40.pdf). 3-A Sanitary Standards, Inc., “Overview of Principles of Hygienic Design,” describes smooth, continuous, crevice-free welds as cleanable and contrasts them with skip welds. https://www.3-a.org/; https://my.3-a.org/Portals/93/Documents/E-Learning%20Modules/Module%201.0.%20Overview%20of%20Principles%20of%20Hygienic%20Design%20-%20Storyline%20output/story_html5.html?ver=2019-01-17-132253-103
[40] Niederhoffer, K., Kellerman, G. R., Lee, A., Liebscher, A., Rapuano, K., & Hancock, J. T. (2025, September 22). “AI-Generated ‘Workslop’ Is Destroying Productivity.” Harvard Business Review. The local file is an internal summary, not the article text. https://hbr.org/2025/09/ai-generated-workslop-is-destroying-productivity
[41] Dillon, E. W., Jaffe, S., Immorlica, N., & Stanton, C. T. (2025, November 13). “Shifting Work Patterns with Generative AI.” NBER Working Paper No. 33795, revised November 2025; local PDF: citations/2025_NBER_W33795_Shifting_Work_Patterns_GenAI.pdf. https://www.nber.org/papers/w33795. The working paper reports a 1.4-hour (12%) weekly decline in Outlook session time from treatment access and a 2-hour (17%) decline in its instrumental-variable estimate for tool use induced by access; the number of emails read fell 4% (ITT) and 6% (LATE). The authors’ abstract for the forthcoming American Economic Review: Insights article reports two fewer hours on email among the 80% of treated workers who used the tool in the second half, less work outside regular hours, and no shift in task quantity or composition from individual-level AI provision. https://benny.aeaweb.org/articles?id=10.1257/aeri.20250275. The study did not observe all work or account for all time saved.
[42] Workday-sponsored global survey of 2,950 full-time decision-makers and software implementation leaders, fielded by Hanover Research in May-June 2025. Its public release reports stated comfort working with AI agents (75%) and being managed by one (30%). The original report is behind a cookie-gated form and is not archived locally. The result does not measure observed resistance or its cause. Workday release: https://en-gb.newsroom.workday.com/2025-08-12-New-Workday-Global-Research-AI-Agents-Are-Here%2C-But-Dont-Call-Them-Boss; see also Berrey, A. (2026, May), “When AI Fear Goes Underground,” and Whatcott, J. (2025, December), “The Data is In: Nobody Wants an AI Boss,” Seampoint.
[43] Choudary, S. P. (2025). Reshuffle: Who Wins When AI Restacks the Knowledge Economy. The book is not archived locally; the local file is a bibliographic stub. Uber Freight describes load matching, carrier matching, and freight pricing and routing tools on its public site. https://reshufflebook.com/; https://www.uberfreight.com/en-US/
[44] Anthropic. (2026, March 5; corrected March 8). “Labor market impacts of AI: A new measure and early evidence.” The authors describe the hiring finding as “just barely statistically significant.” Local PDF: citations/anthropic-economic-index/2026_Anthropic_Labor_Market_Impacts_March5.pdf. https://www.anthropic.com/research/labor-market-impacts
[45] Emanuel, N., Harrington, E., & Pallais, A. (2026, June 1). “Remote Work Leaves Younger Workers Sidelined.” Federal Reserve Bank of New York, Liberty Street Economics. https://libertystreeteconomics.newyorkfed.org/2026/06/remote-work-leaves-younger-workers-sidelined/
[46] Milanez, A. (2023). “The impact of AI on the workplace: Evidence from OECD case studies of AI implementation.” OECD Social, Employment and Migration Working Papers, No. 289. The UK flood-risk case is qualitative: AI automated most manual map quality-control steps, workers did more research, planning, and project management, and one interviewed worker reported greater interest and enjoyment. The wider study draws on nearly 100 cases in manufacturing and finance across eight OECD countries; it is not a representative estimate. Local PDF: citations/2023_Milanez_OECD_AI_Workplace_Case_Studies.pdf. https://doi.org/10.1787/2247ce58-en. Afshar, M., Baumann, M. R., Resnik, F., et al. (2025). “A pragmatic randomized controlled trial of ambient artificial intelligence to improve health practitioner well-being.” NEJM AI, 2(12). A 24-week, stepped-wedge individually randomized trial of 66 practitioners; note-writing time fell by 0.36 hours (about 22 minutes) per eight hours of patient time, and the combined work-exhaustion/interpersonal-disengagement score fell by 0.44 points on a five-point scale. Professional fulfillment did not significantly increase. The trial measured work outside regular hours but did not provide a complete accounting of where time saved went. Full text from PubMed Central is preserved as plain text: citations/2025_Afshar_NEJM_AI_Ambient_Scribe_RCT_PMC.txt. https://doi.org/10.1056/aioa2500945; https://pmc.ncbi.nlm.nih.gov/articles/PMC12858090/
[47] Bignami, E. G., et al. (2025). “Balancing Innovation and Control: The European Union AI Act in an Era of Global Uncertainty.” JMIR AI 4:e75527. Cites Renda, A., et al. (2021). https://op.europa.eu/en/publication-detail/-/publication/55538b70-a638-11eb-9585-01aa75ed71a1/language-en
[48] Regulation (EU) 2026/1744 (Digital Omnibus on AI), amending Regulation (EU) 2024/1689, published in the Official Journal of the European Union on July 24, 2026 and in force July 27, 2026. New application dates: Annex III standalone high-risk systems, December 2, 2027; Annex I high-risk AI embedded in products covered by EU product-safety law, August 2, 2028. Article 50 transparency obligations applied from August 2, 2026, with a grace period to December 2, 2026 for marking content from systems already on the market. https://eur-lex.europa.eu/eli/reg/2026/1744/oj/eng
[49] Seampoint’s replication README records the calculated Fleiss’ kappa (0.81) and Cronbach’s alpha (0.88); these are internal results, not values supplied by the external citation. Landis, J. R. & Koch, G. G. (1977). “The measurement of observer agreement for categorical data.” Biometrics. The paper is cited for the kappa interpretation only. The internal README and prompts are preserved under notebook/99_Replication_Package/; the journal article is online. https://doi.org/10.2307/2529310
[50] Seampoint LLC. (2026). O*NET 31.0 currency check and May 2025 OEWS wage-vintage check. Scripts, results, and scope notes: notebook/05_next_steps/onet-31-currency-check/ and notebook/05_next_steps/oews-wage-vintage-check/.
[51] Seampoint LLC. (2026, April). “Utah’s AI Workforce Reality: What 1.6 Million Workers and 20 Employers Tell Us About What’s Coming.” https://seampoint.com/research/utah-ai-workforce-reality/
Cite This Research
APA Format
Seampoint. (2026, September). The distillation of work: Where AI opportunity concentrates and how leaders capture it (September 2026 ed.). Seampoint LLC. https://seampoint.com/research/distillation-of-work/
What does this mean for your organization?
Let us map the AI opportunity in your specific workforce, using the same task-level methodology.